Maps
Maps FAQ

Map Room Guide
World
Africa
Americas
Asia
Australia/Pacific
Europe
Middle East
Polar/Oceans
Russia/Republics
U.S.
Texas
Historical
Thematic
Topographic
Other Map Sites
Map Sites
Map Dealers
Cartographic Reference
City Map Sites
Country Map Sites
Historical Map Sites
Outline Map Sites
Route Planning Sites
State Map Sites
Weather Map Sites
Topical Map Sites
Avian Influenza
Oil and Gas Maps
More Topical Maps
Perry-Castañeda Library
Note: All maps linked from this page are from Atlas of Mexico, published by the University of Texas at Austin Bureau of Business Research. All of these maps are Copyright 1975 Board of Regents, The University of Texas System. For information on using these maps, see the UTLOL Materials Usage Statement page.Page One (495k)
Page Two (341k)
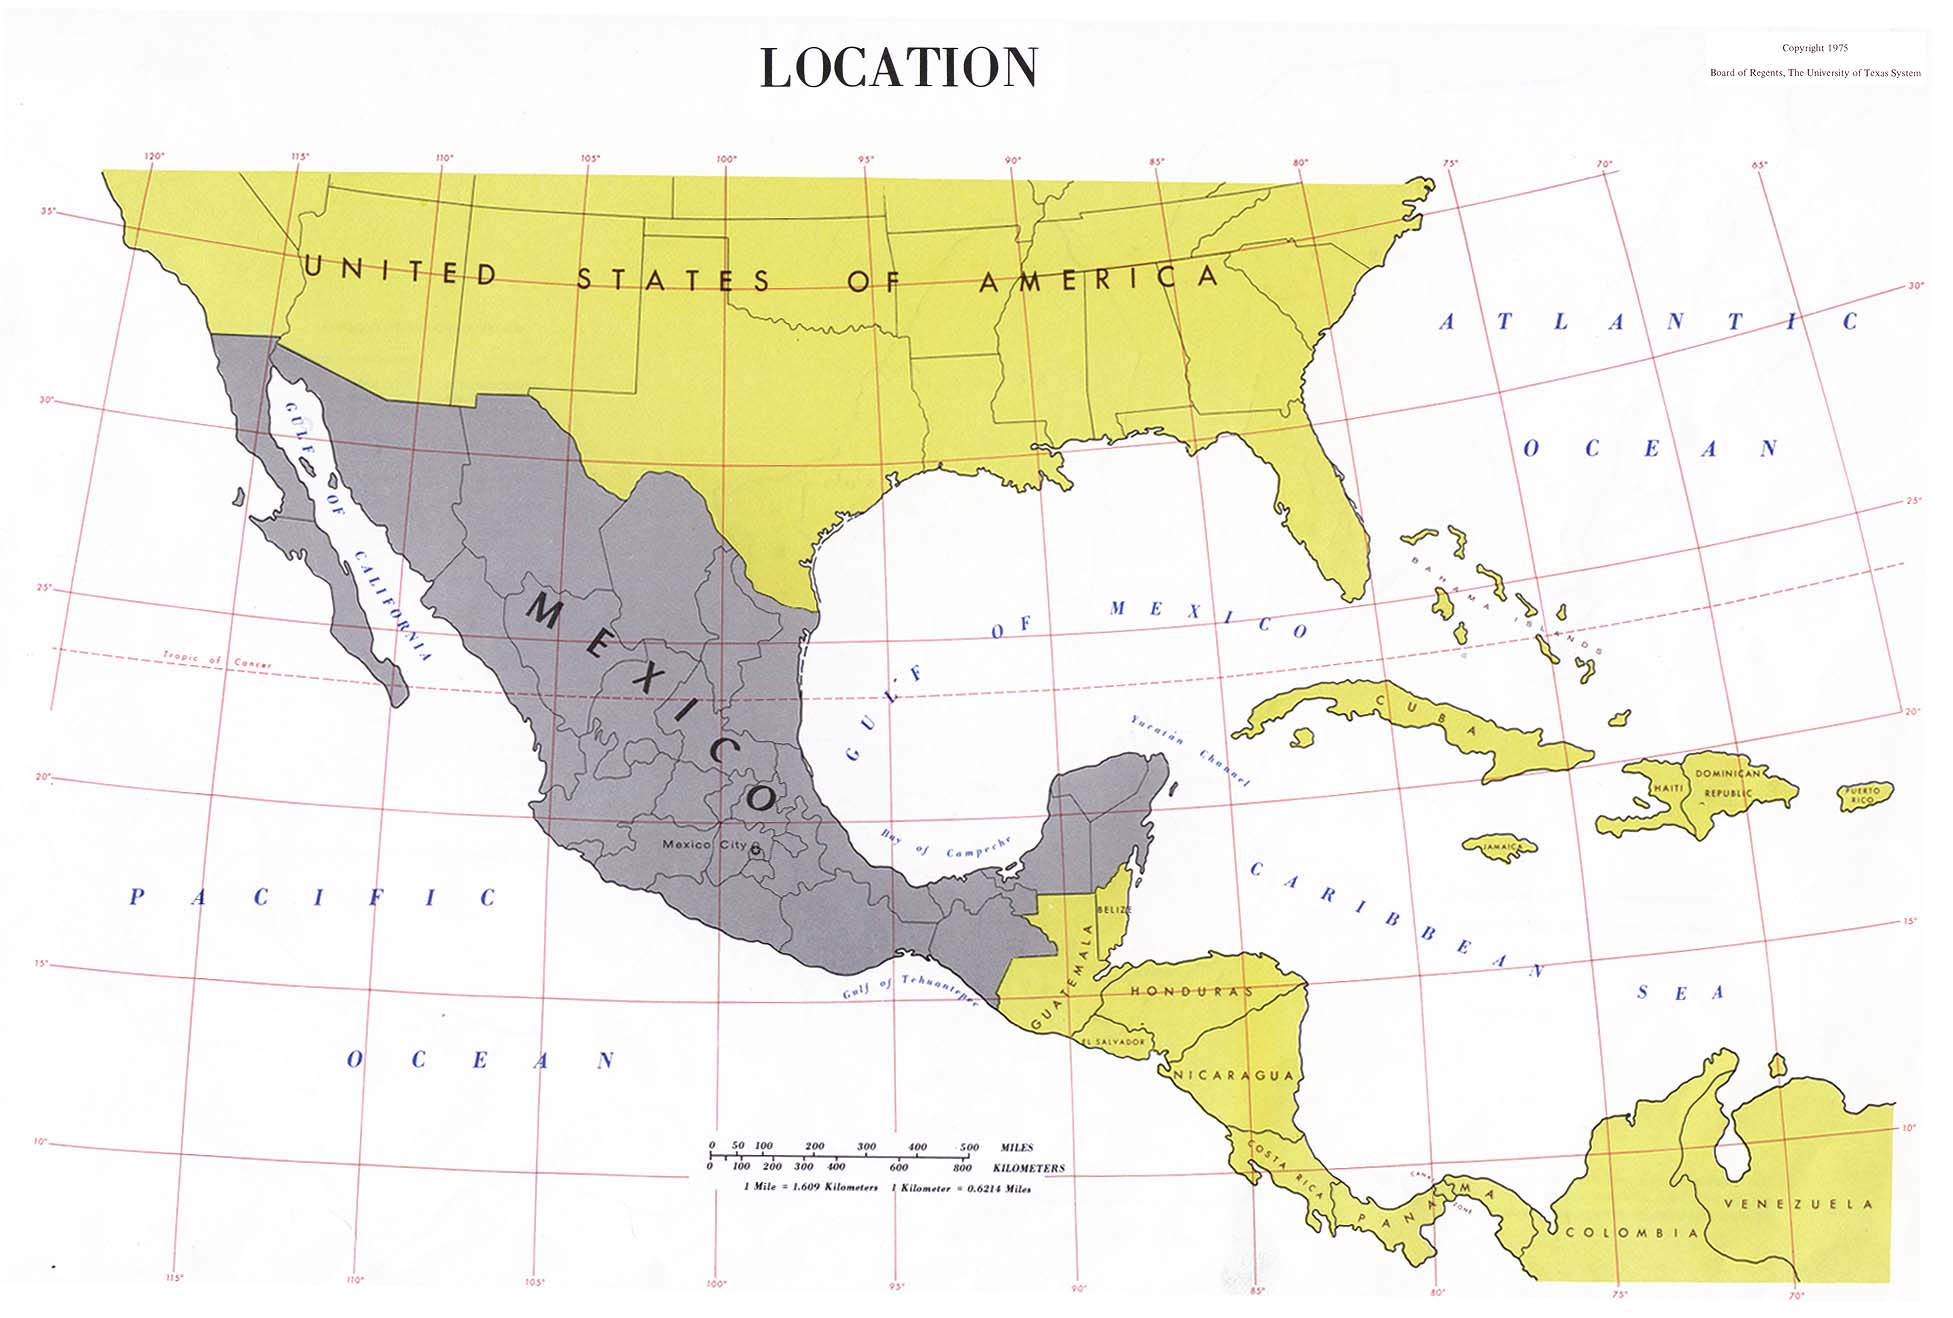
Location (161K)
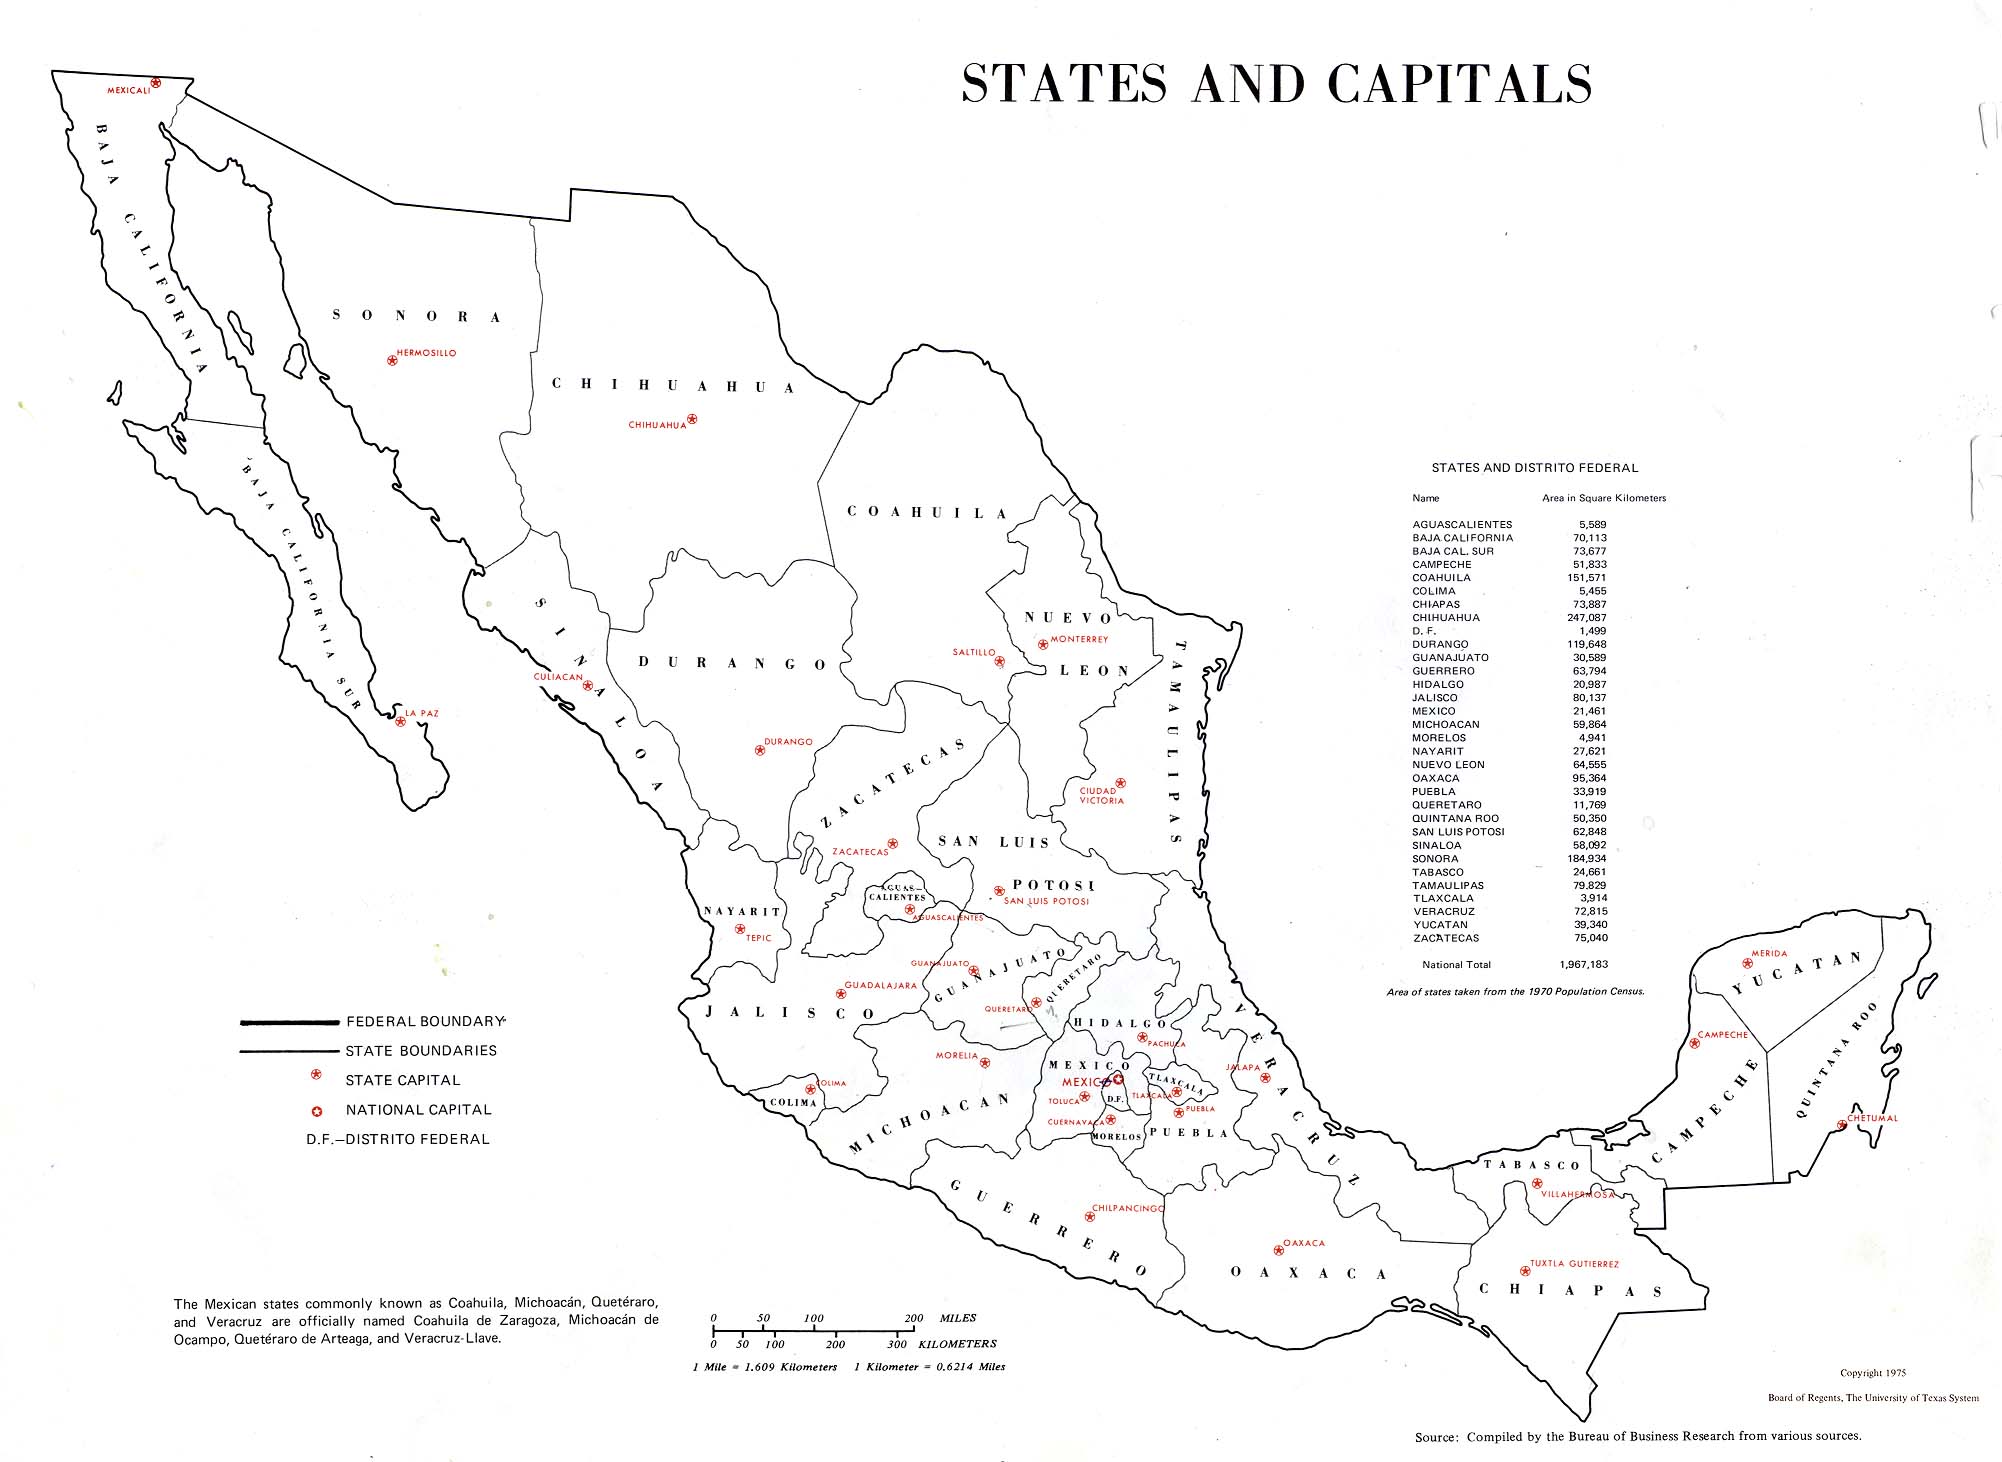
States and Capitals (180K)
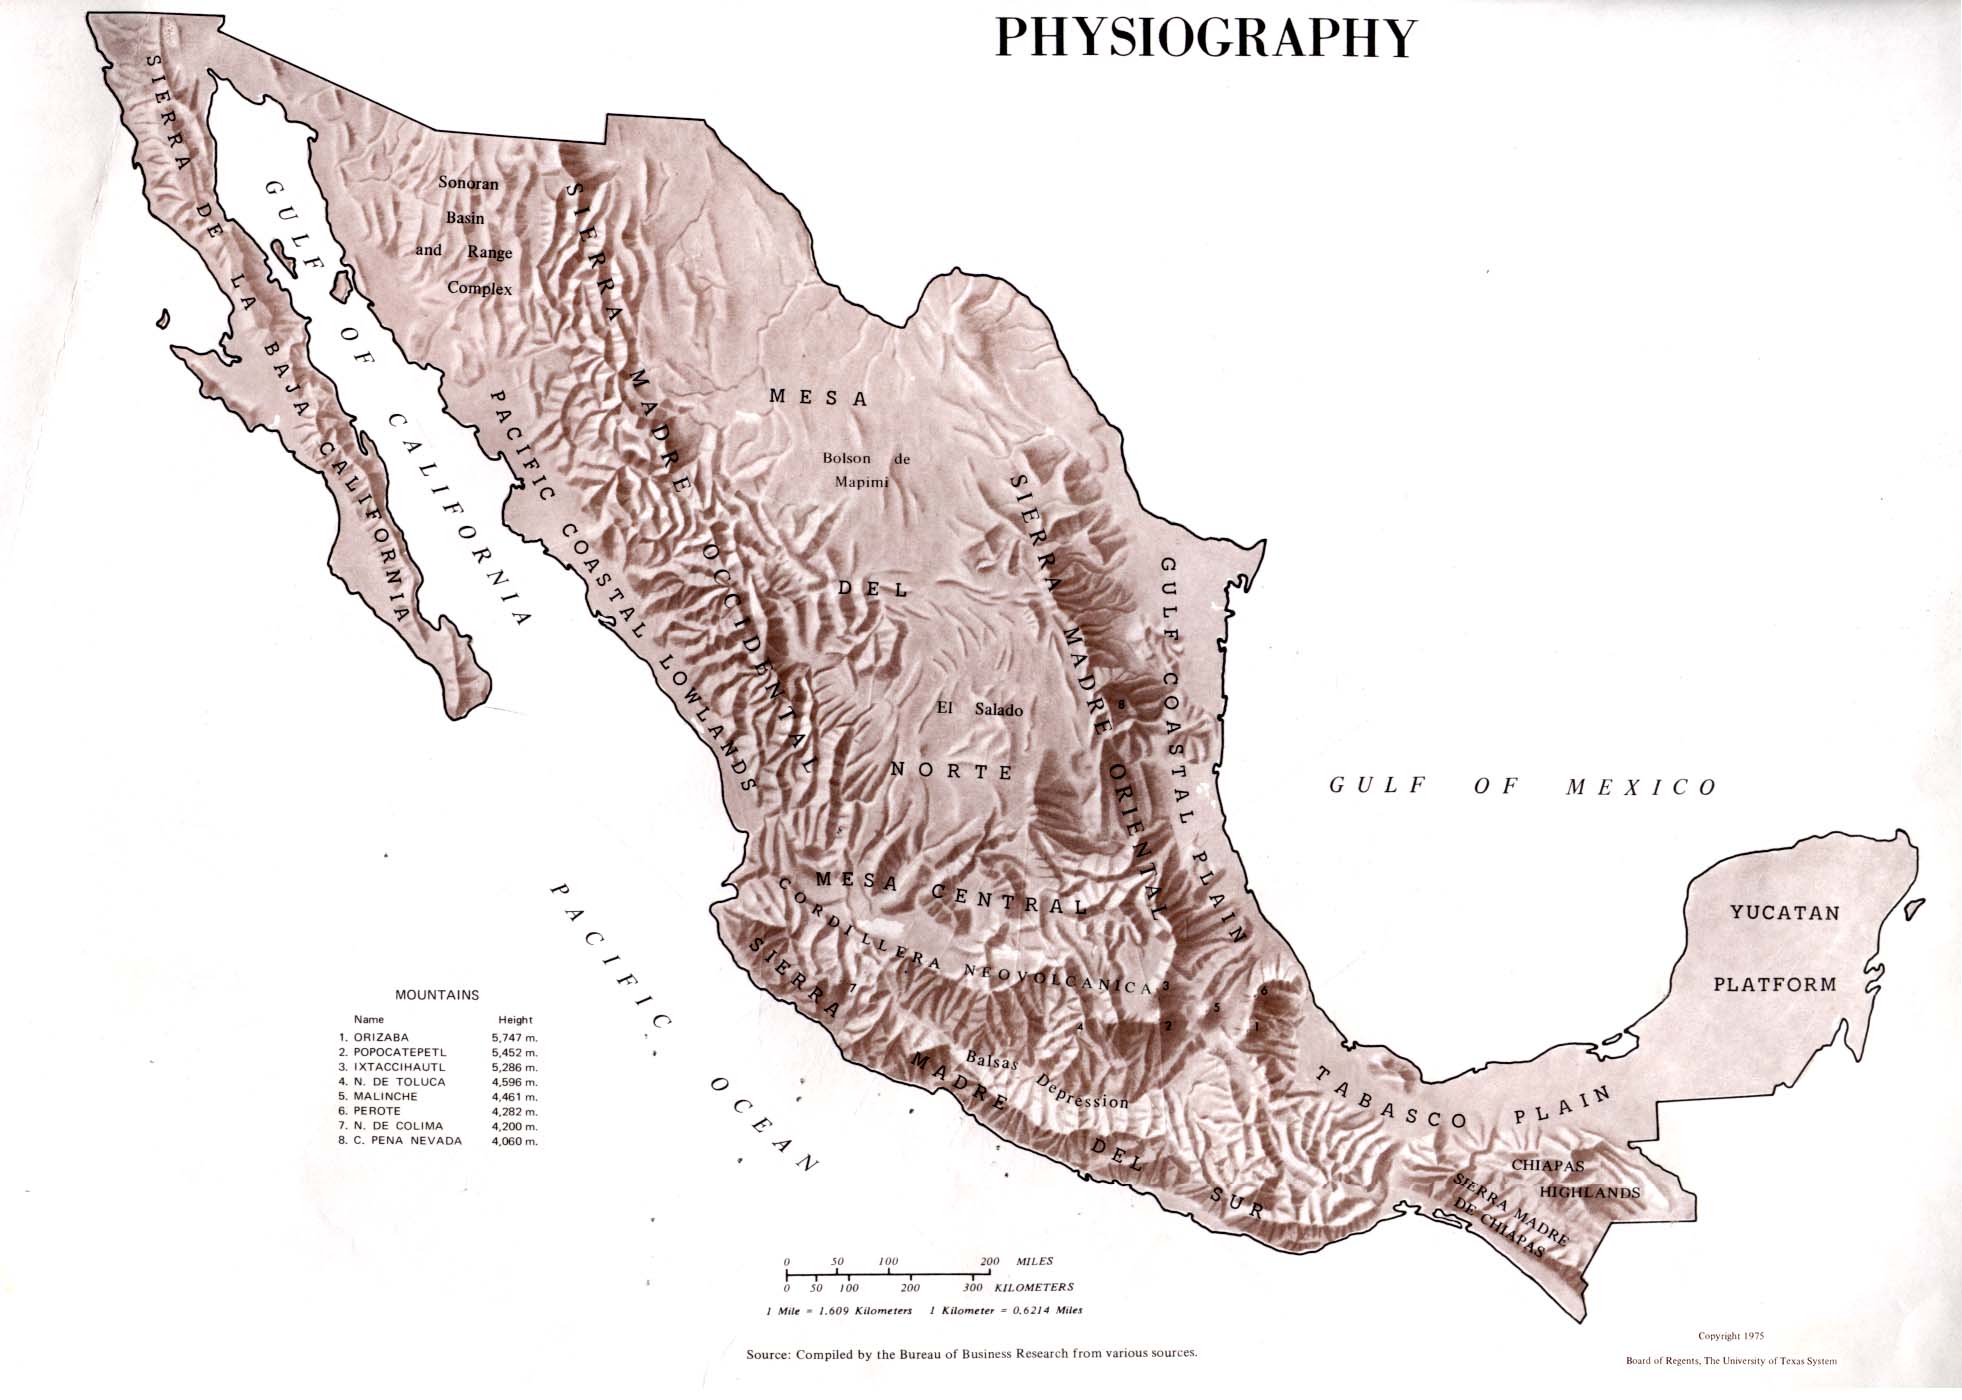
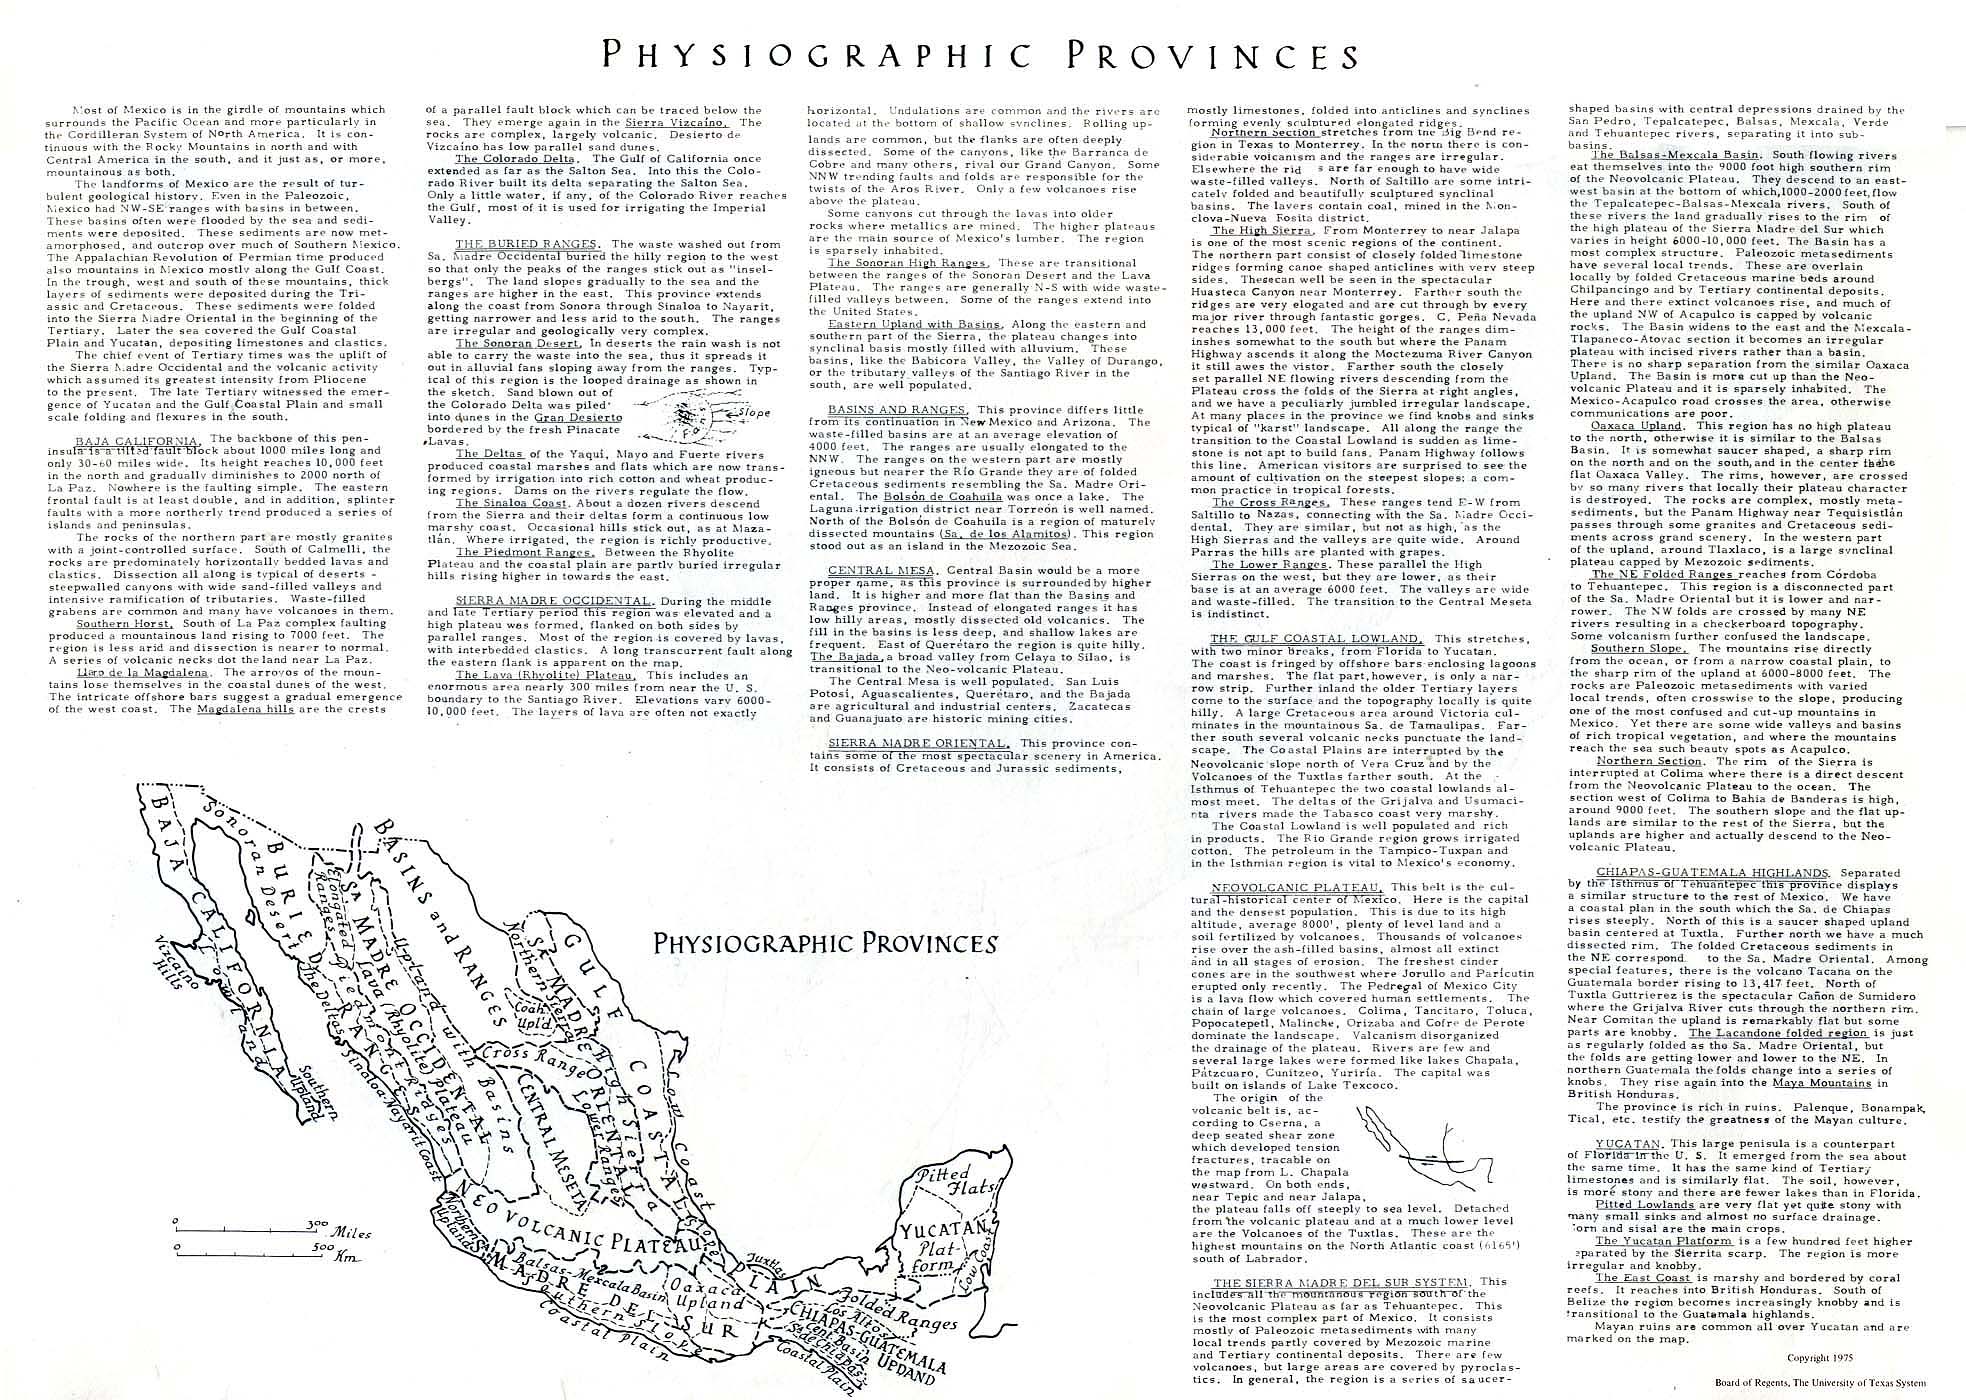
Physiography (202K) and Text Description (634K)
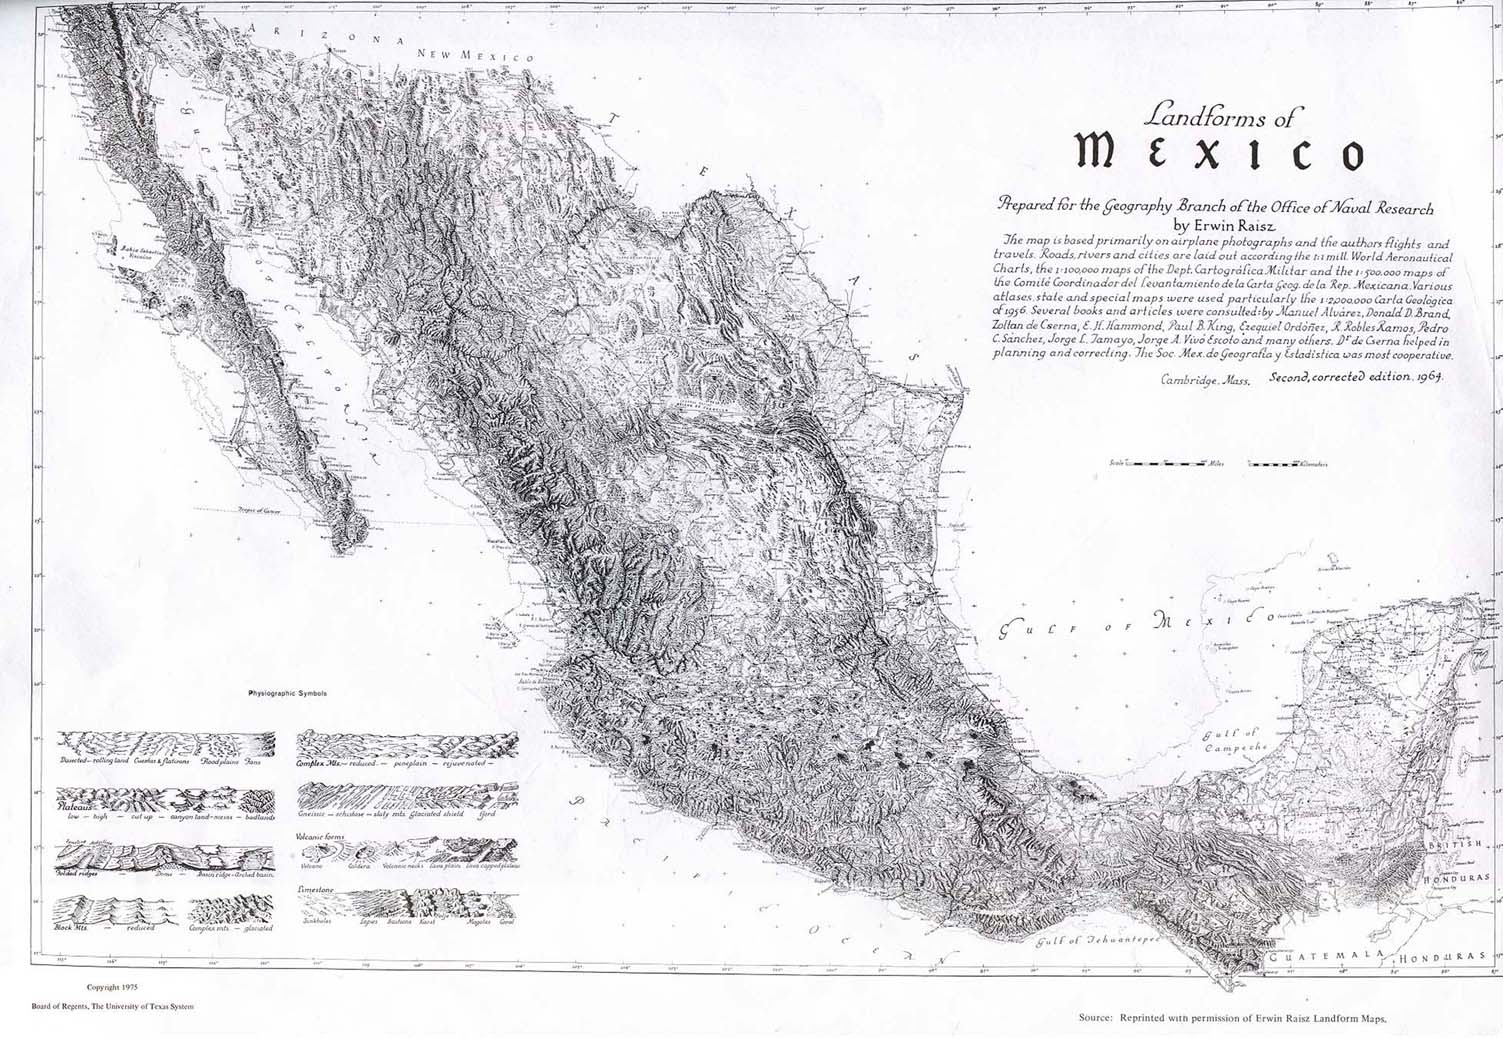
Landforms (313K)
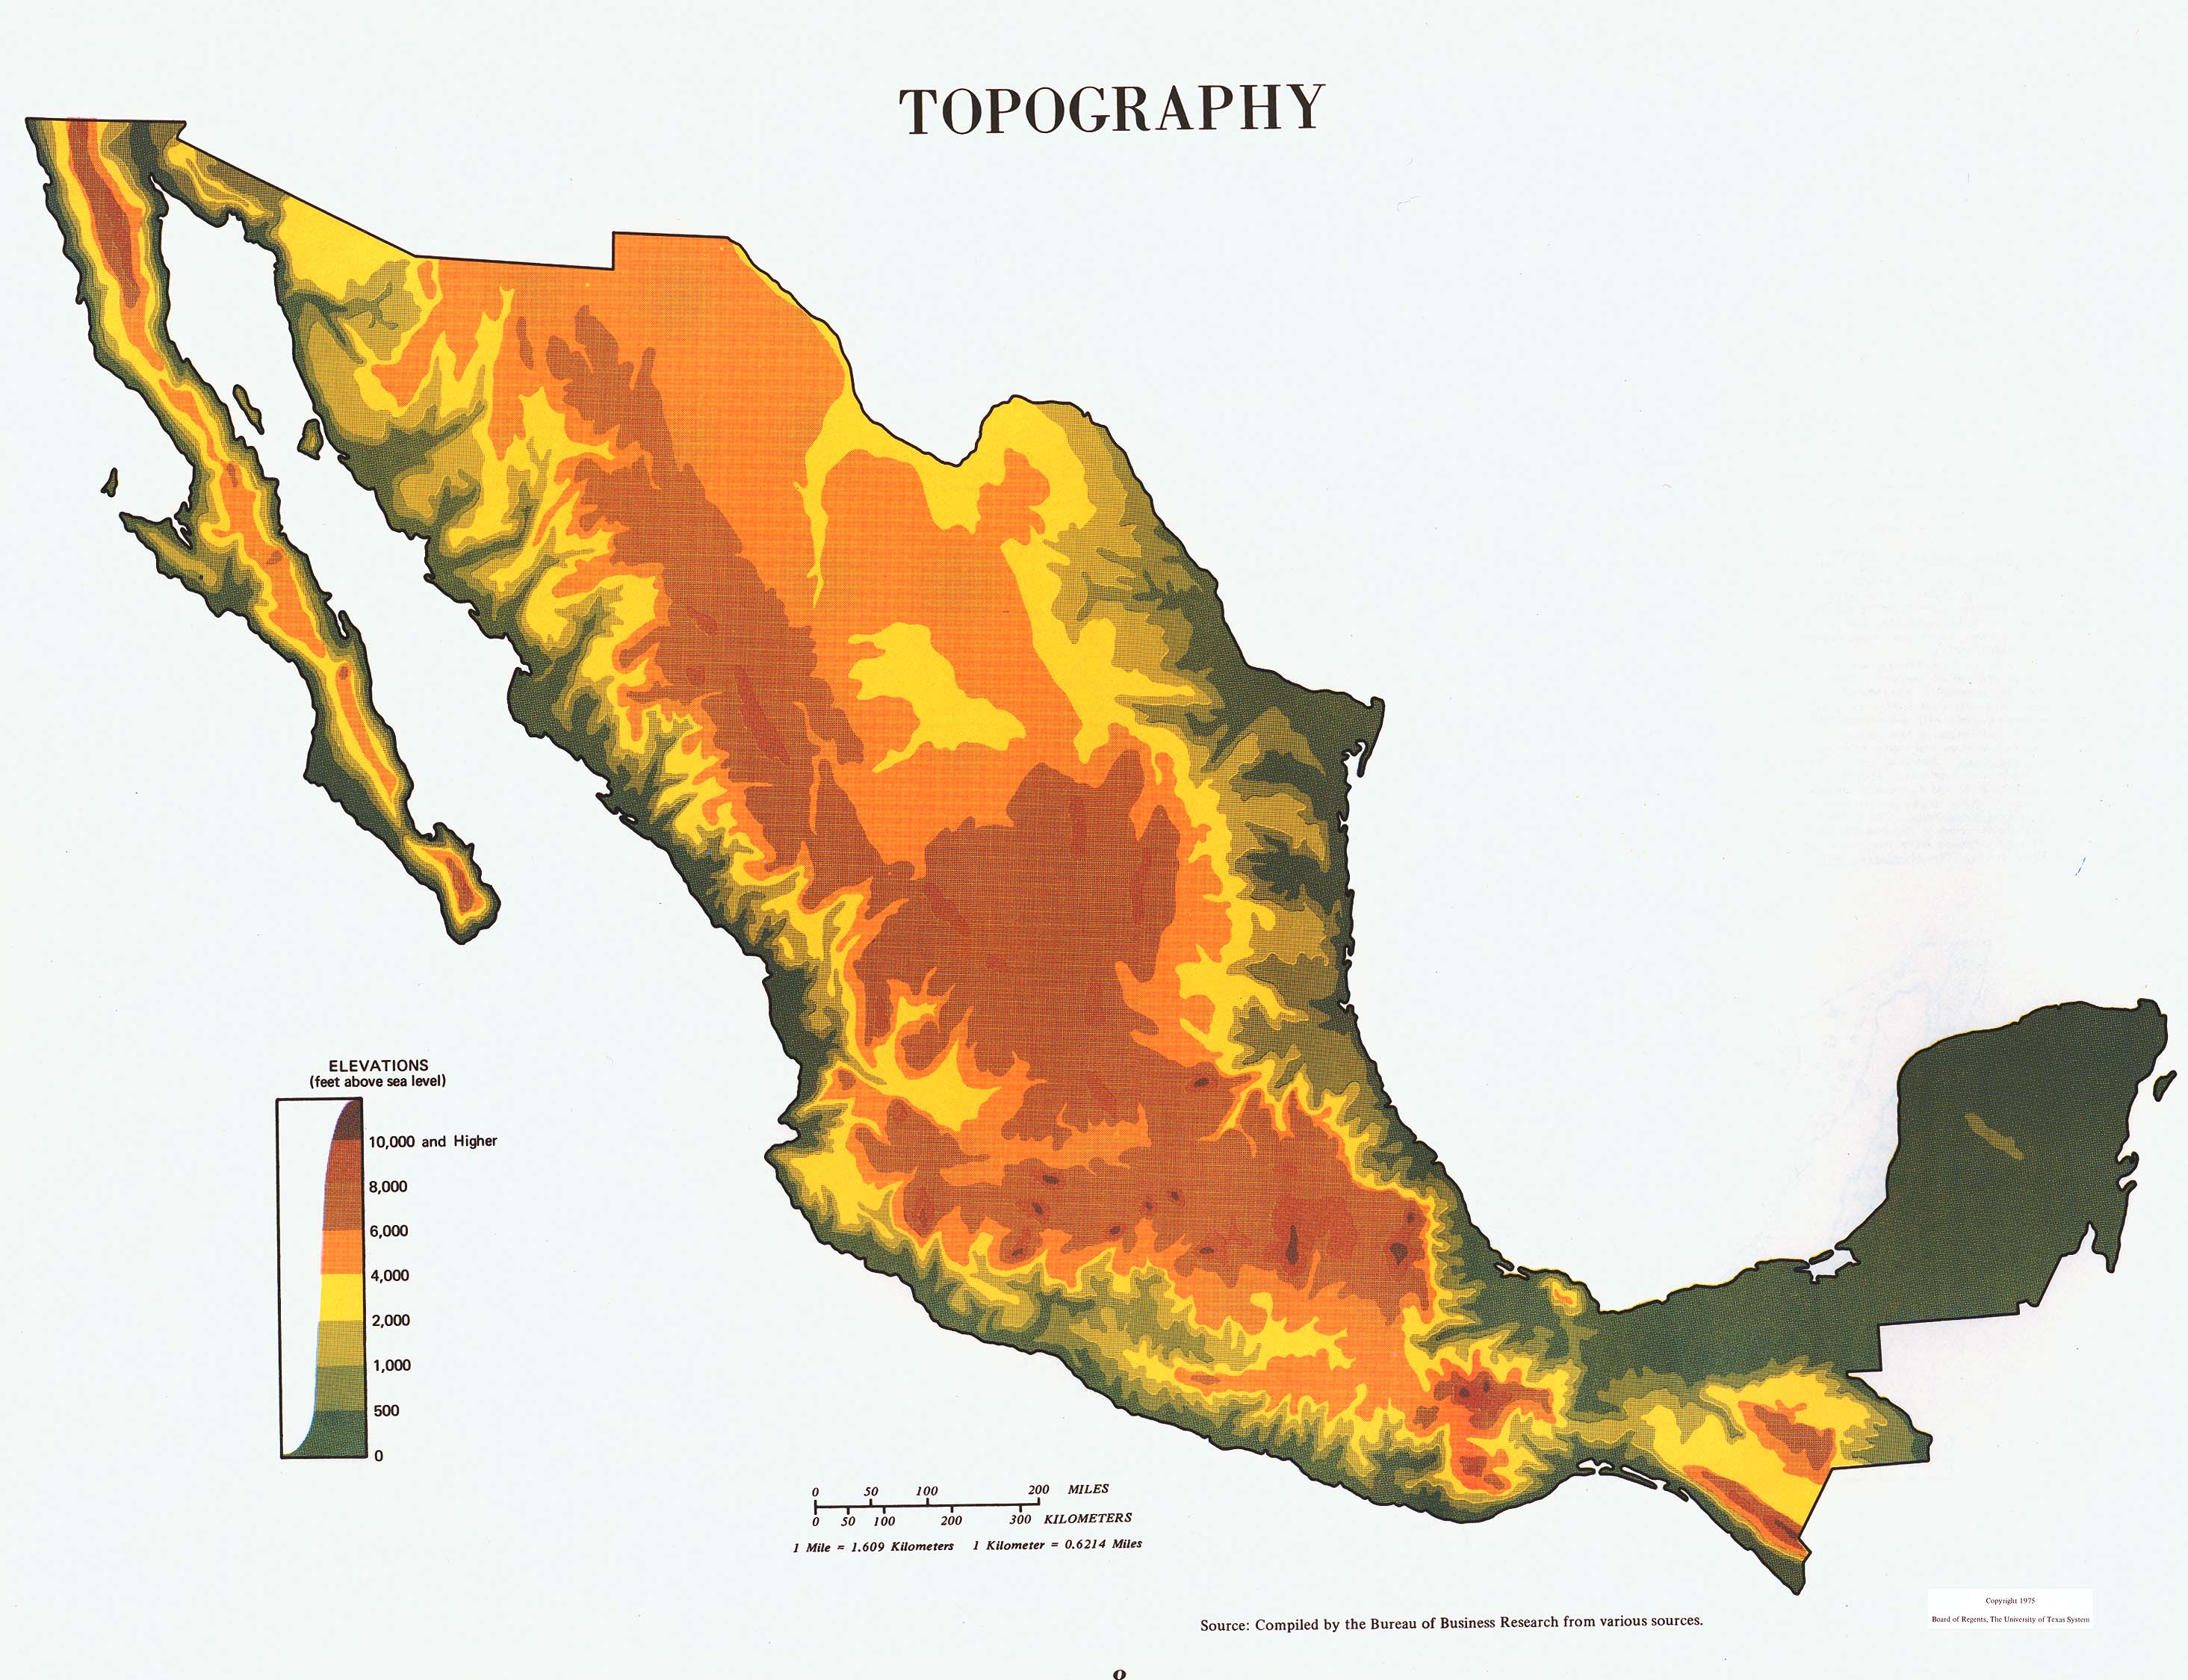
Topography (634K)
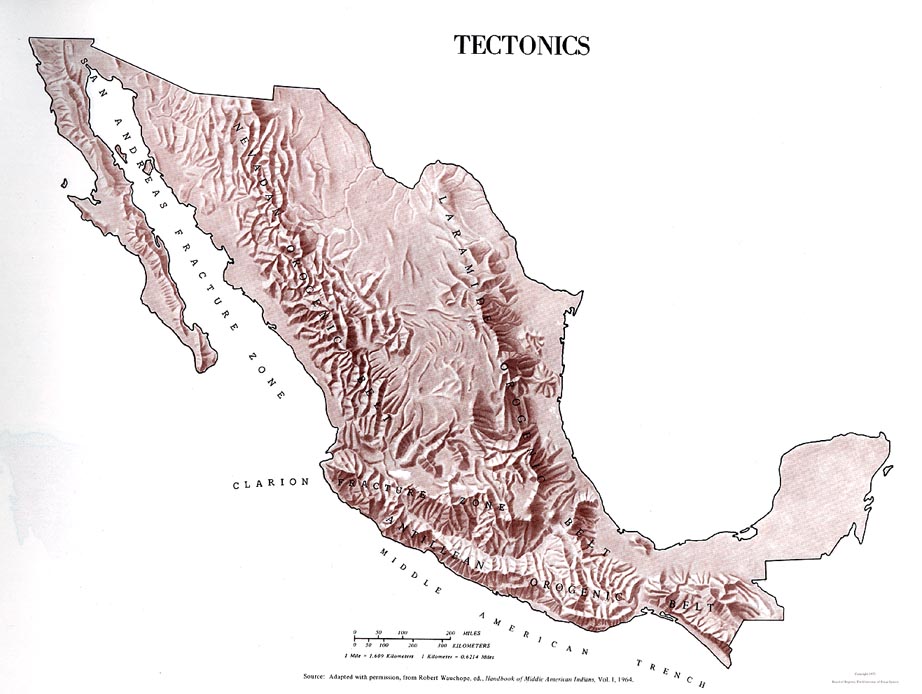
Tectonics (633K)
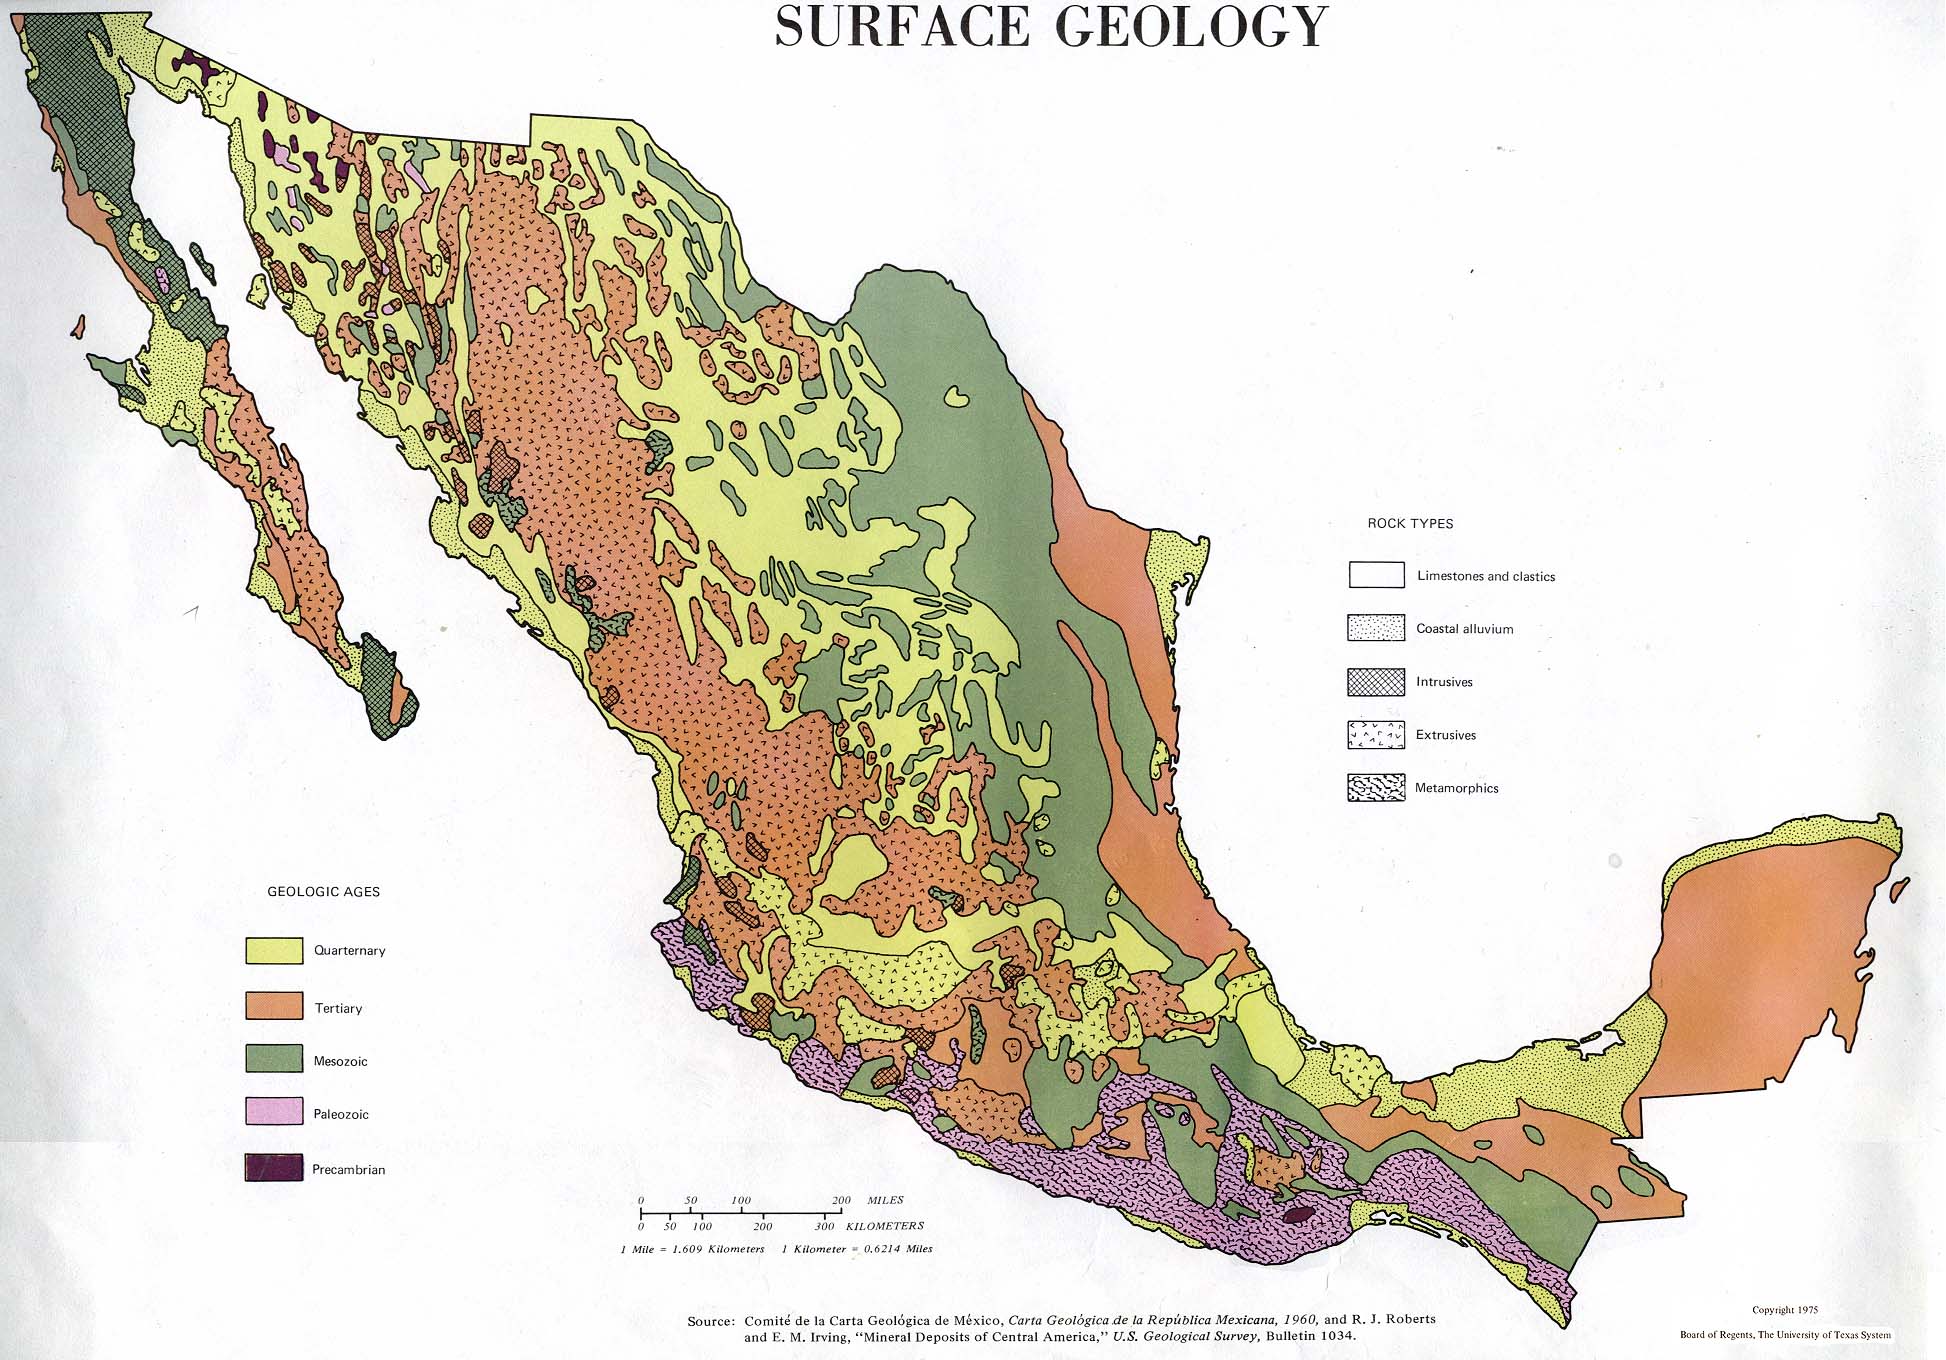
Surface Geology (294K)
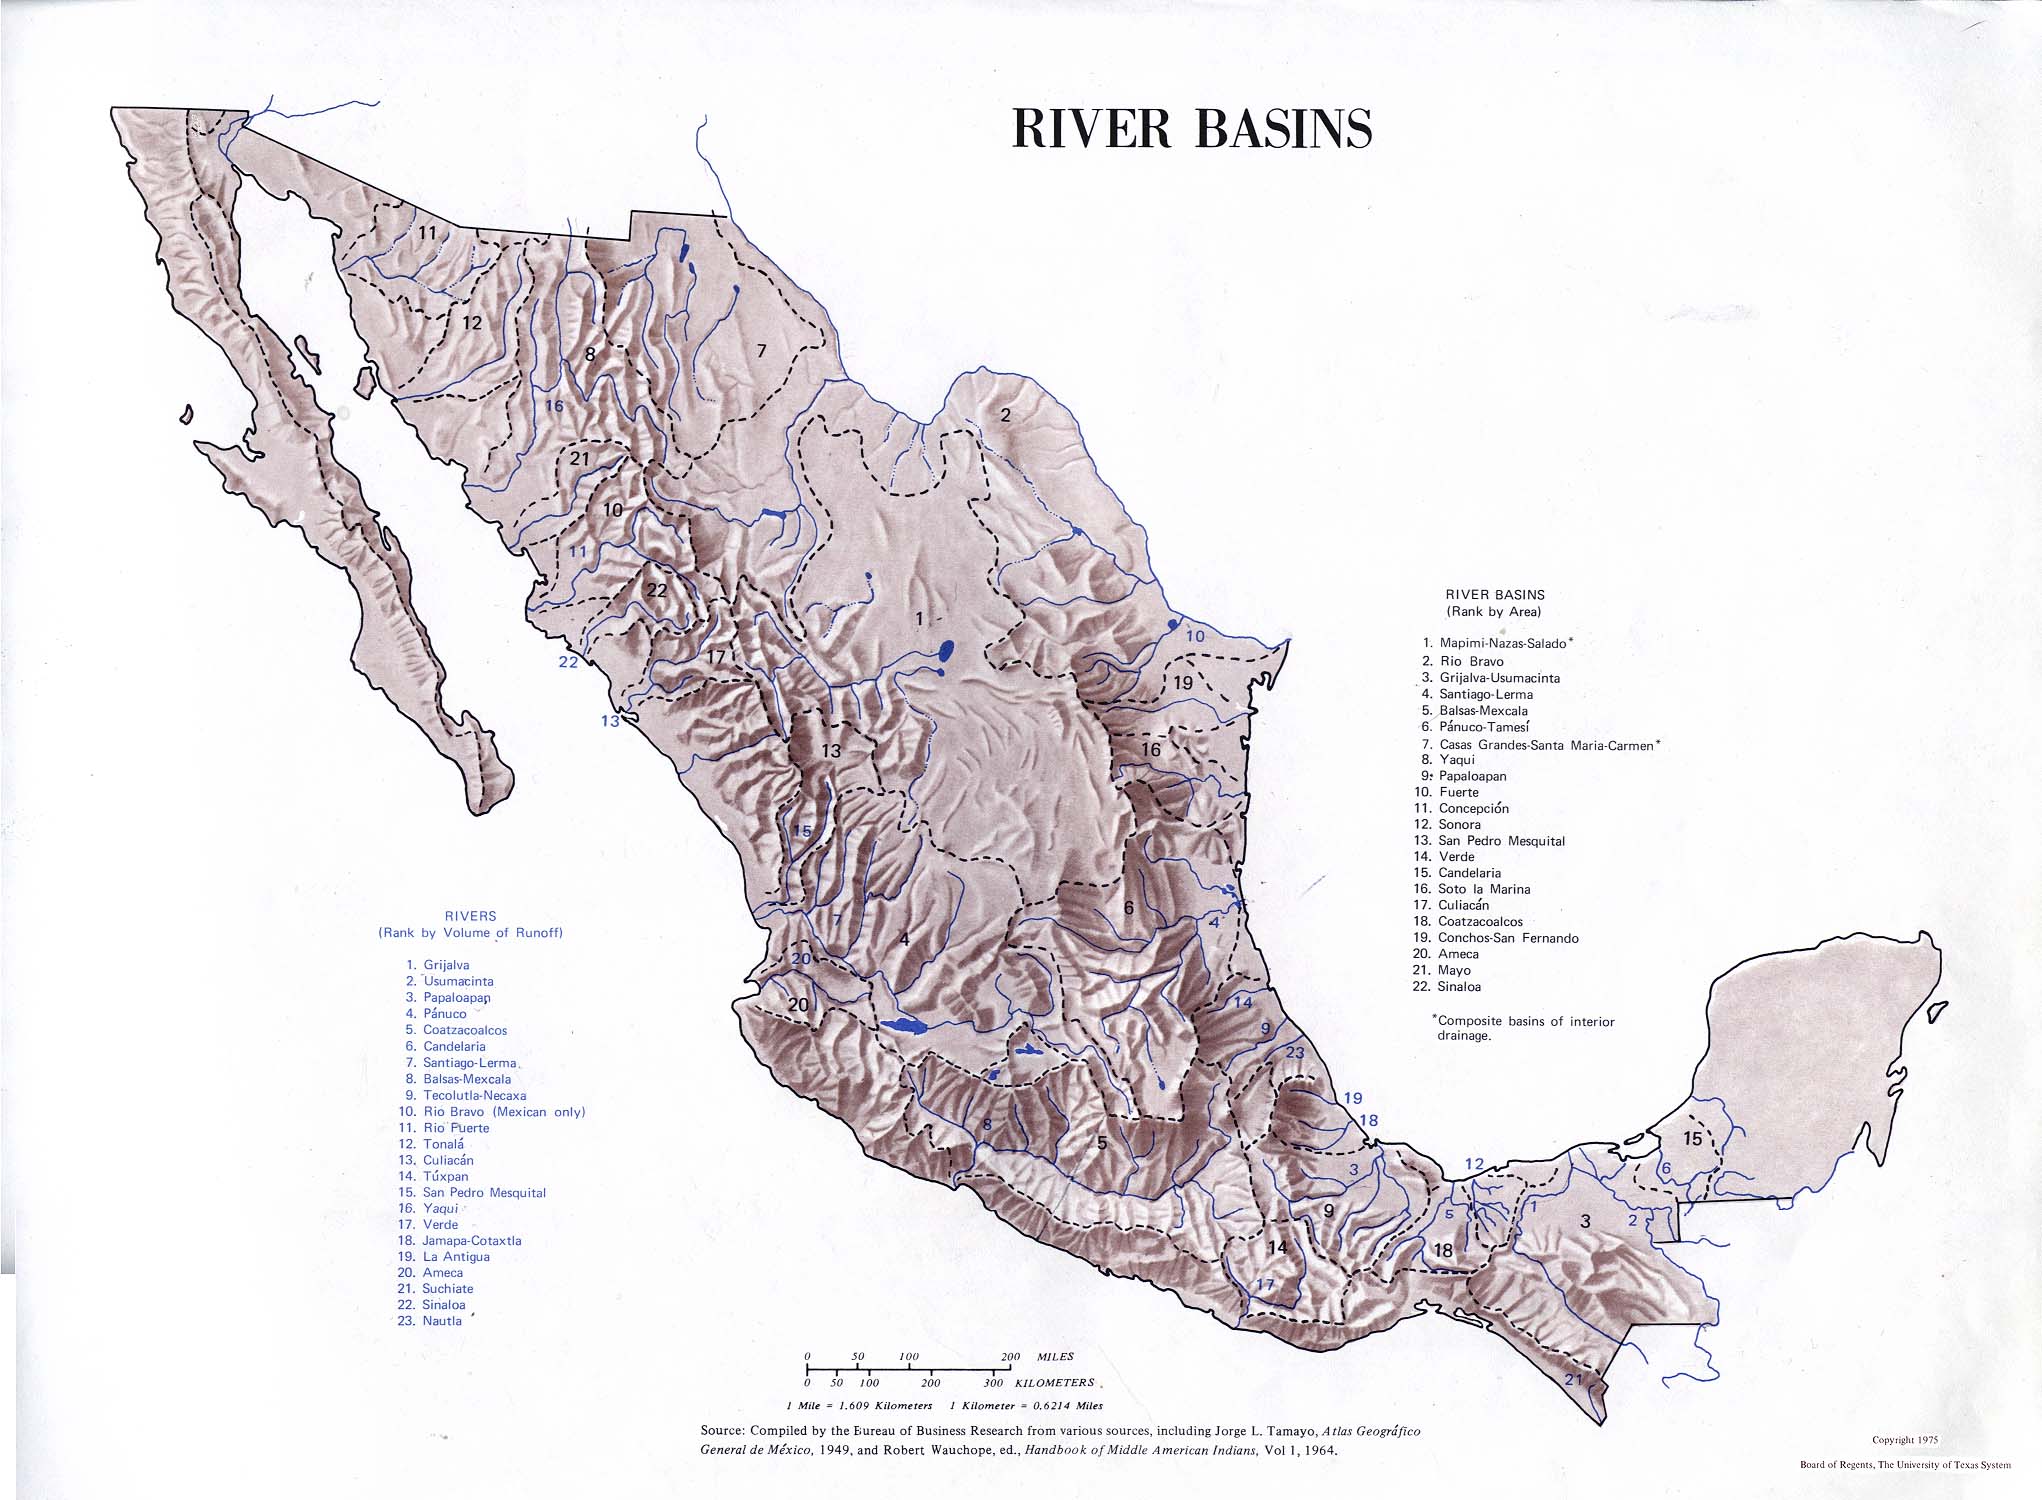
River Basins (294K)
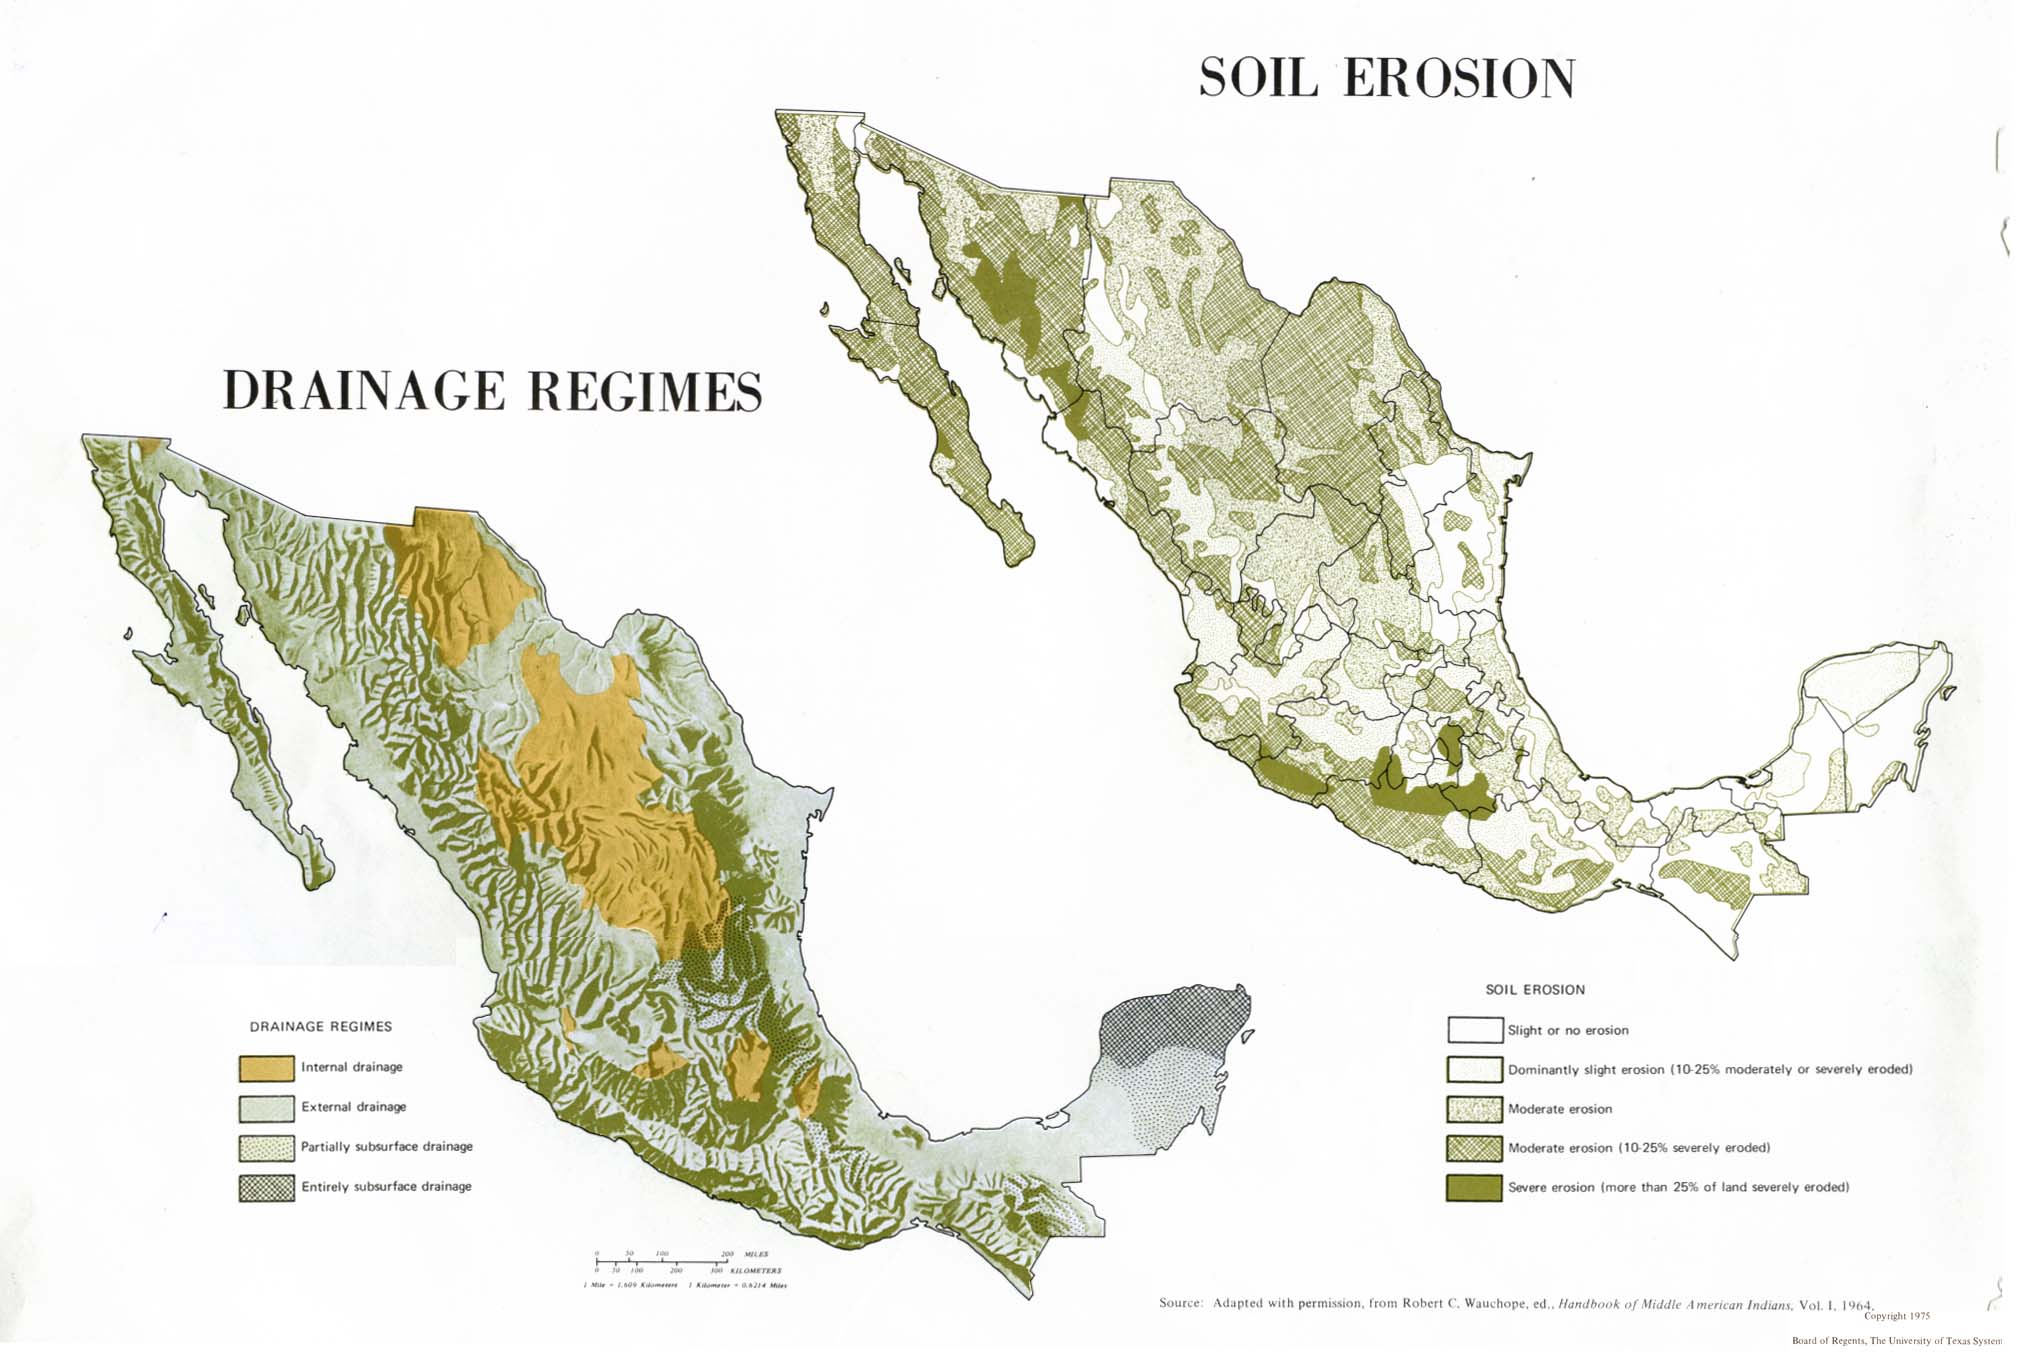
Drainage Regimes and Soil Erosion (224K)
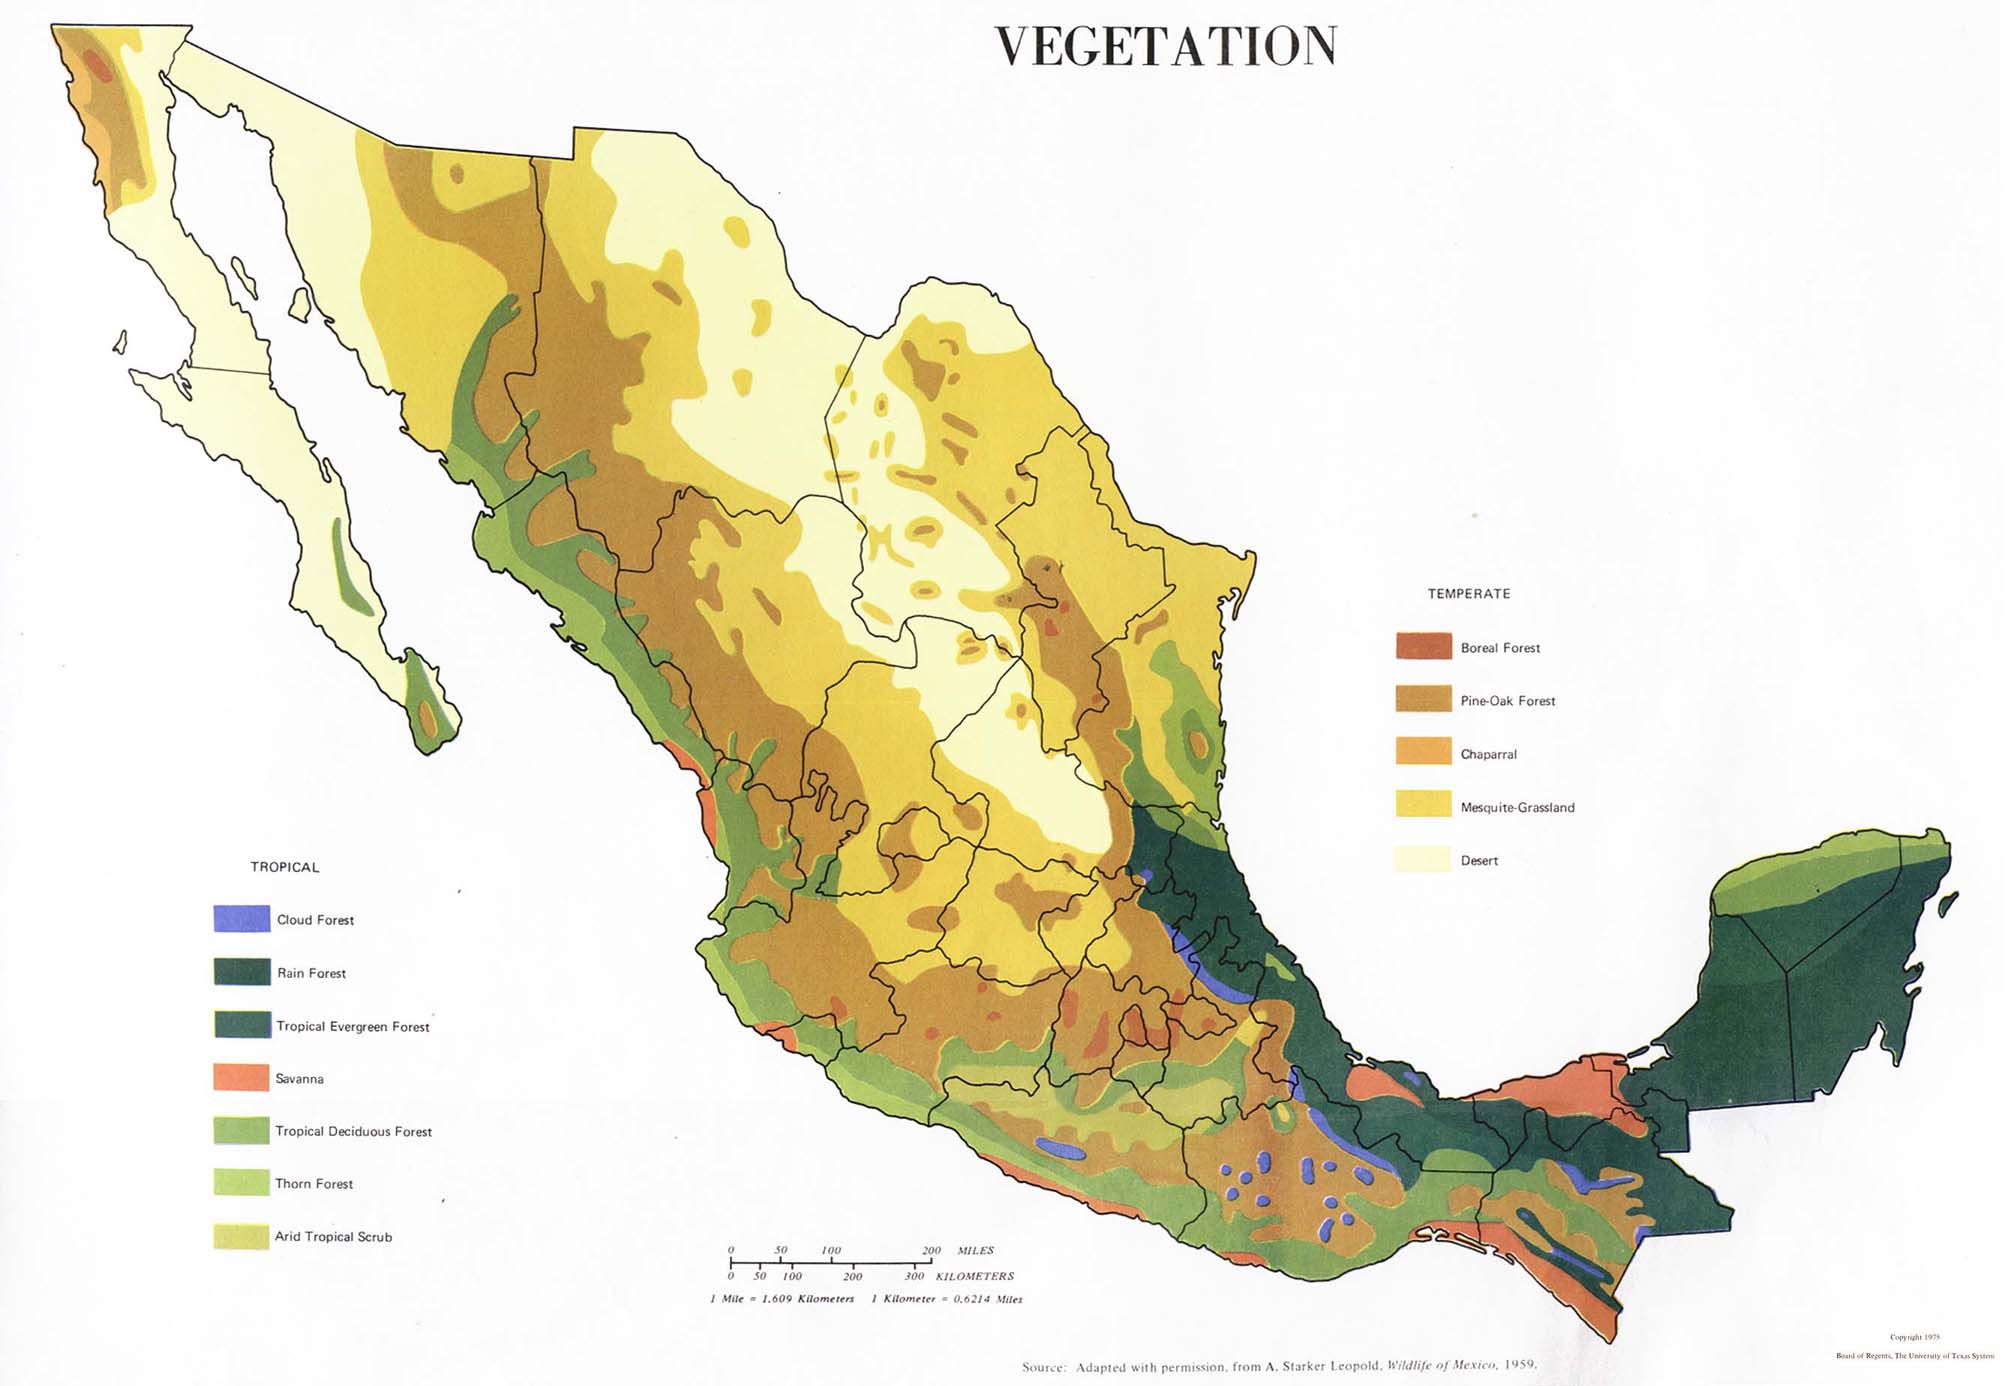
Vegetation (165K)
Climatic Water Balance Diagram-East (142K) and Climatic Water Diagram-West (163K)
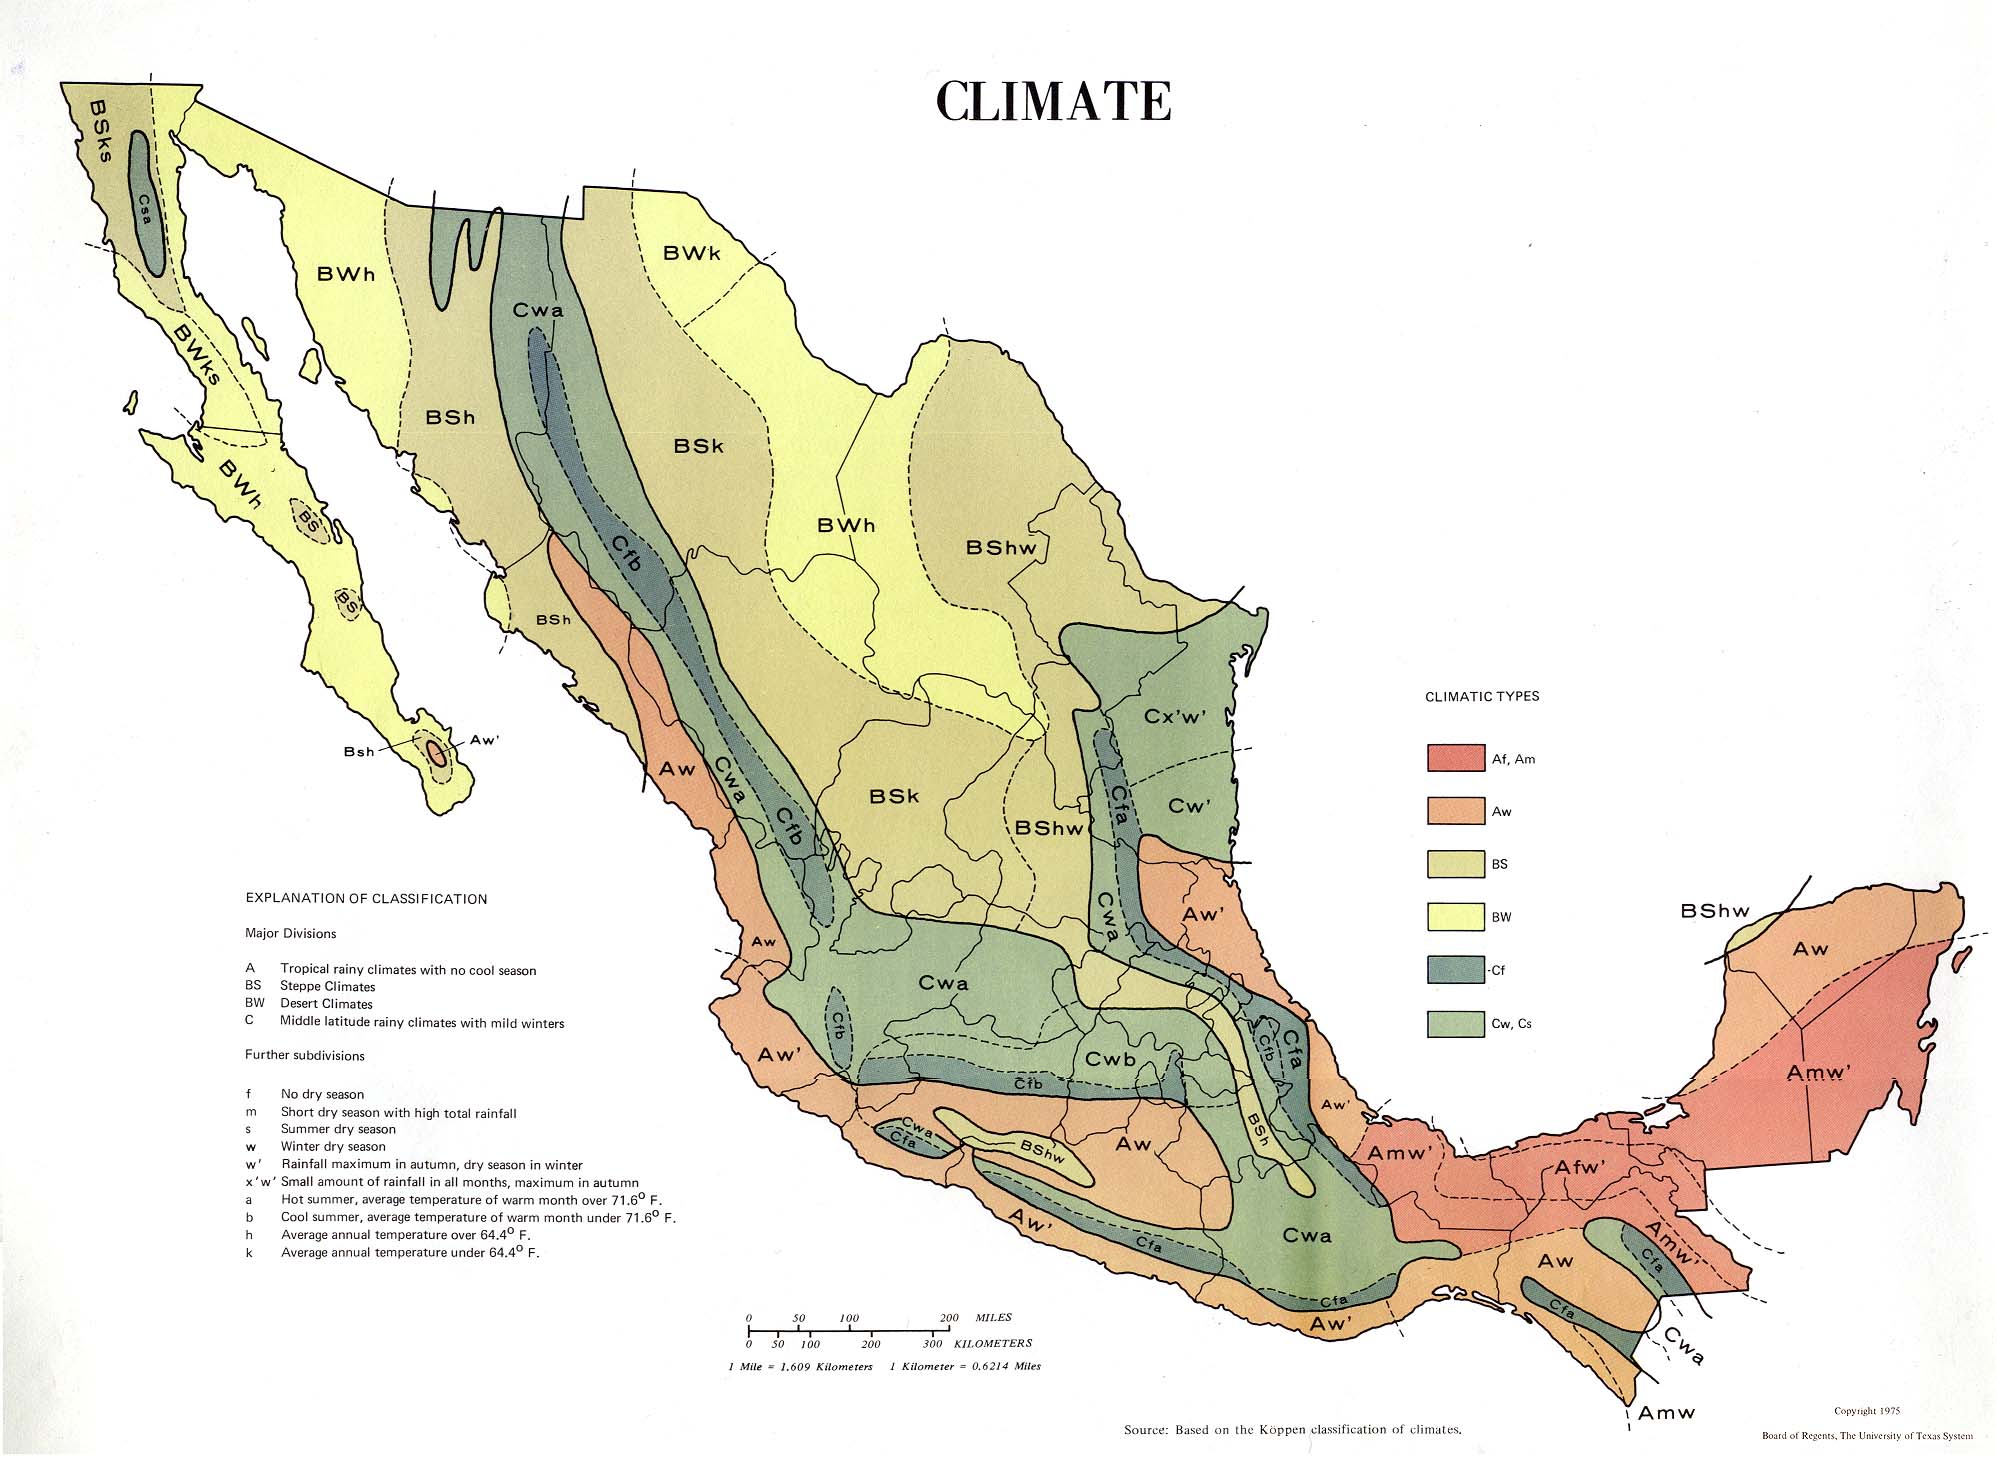
Climate (271K)
Mean Annual Precipitation (297K)
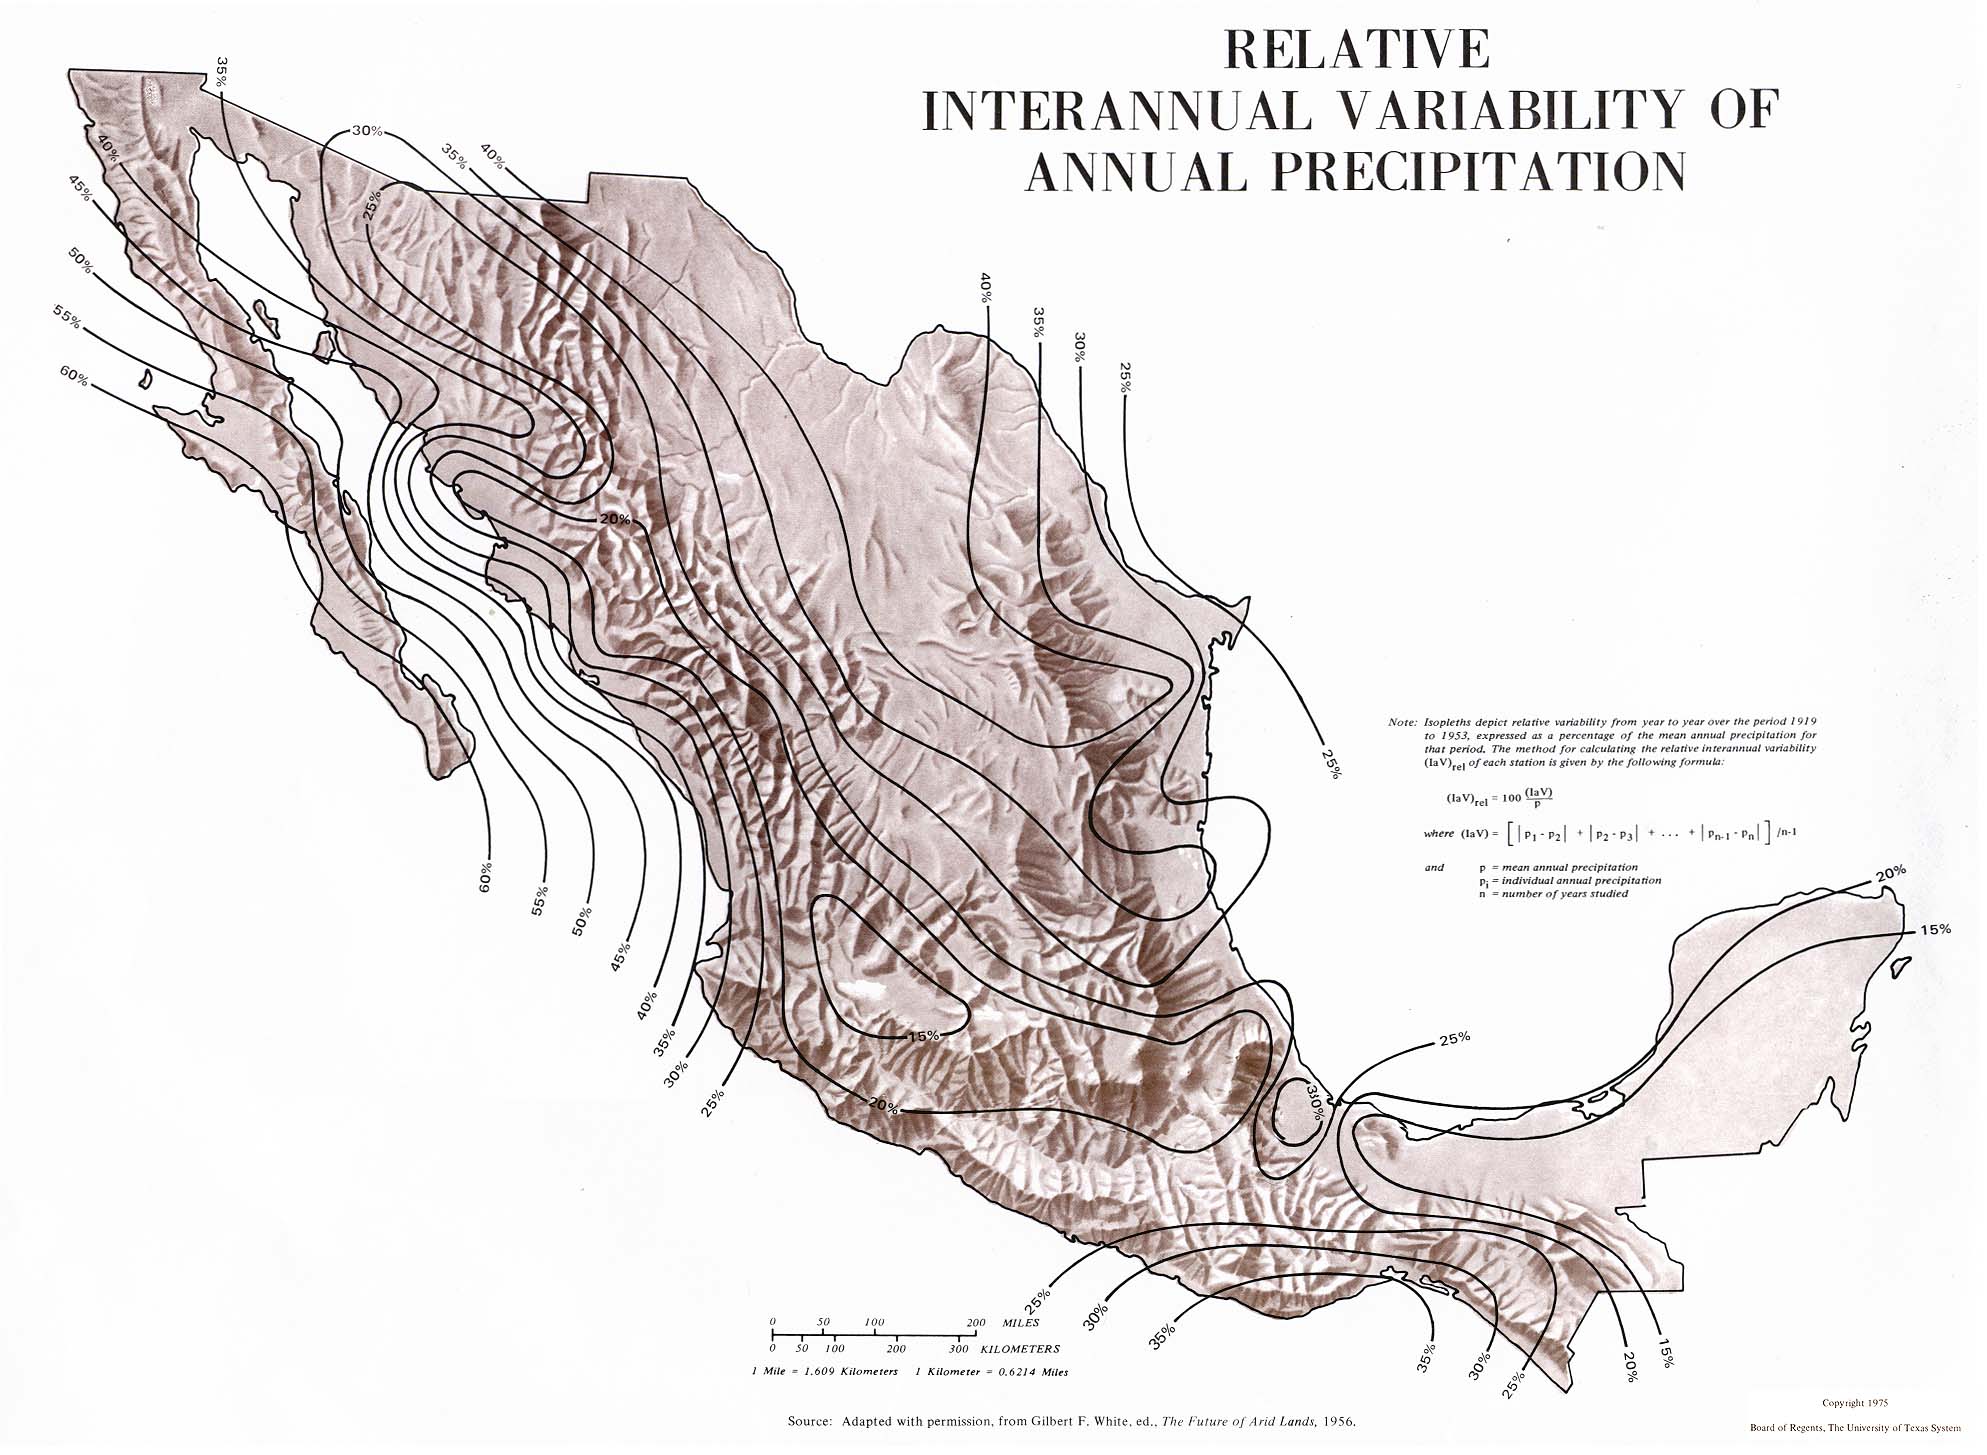
Relative Interannual Variability of Annual Precipitation (294K)
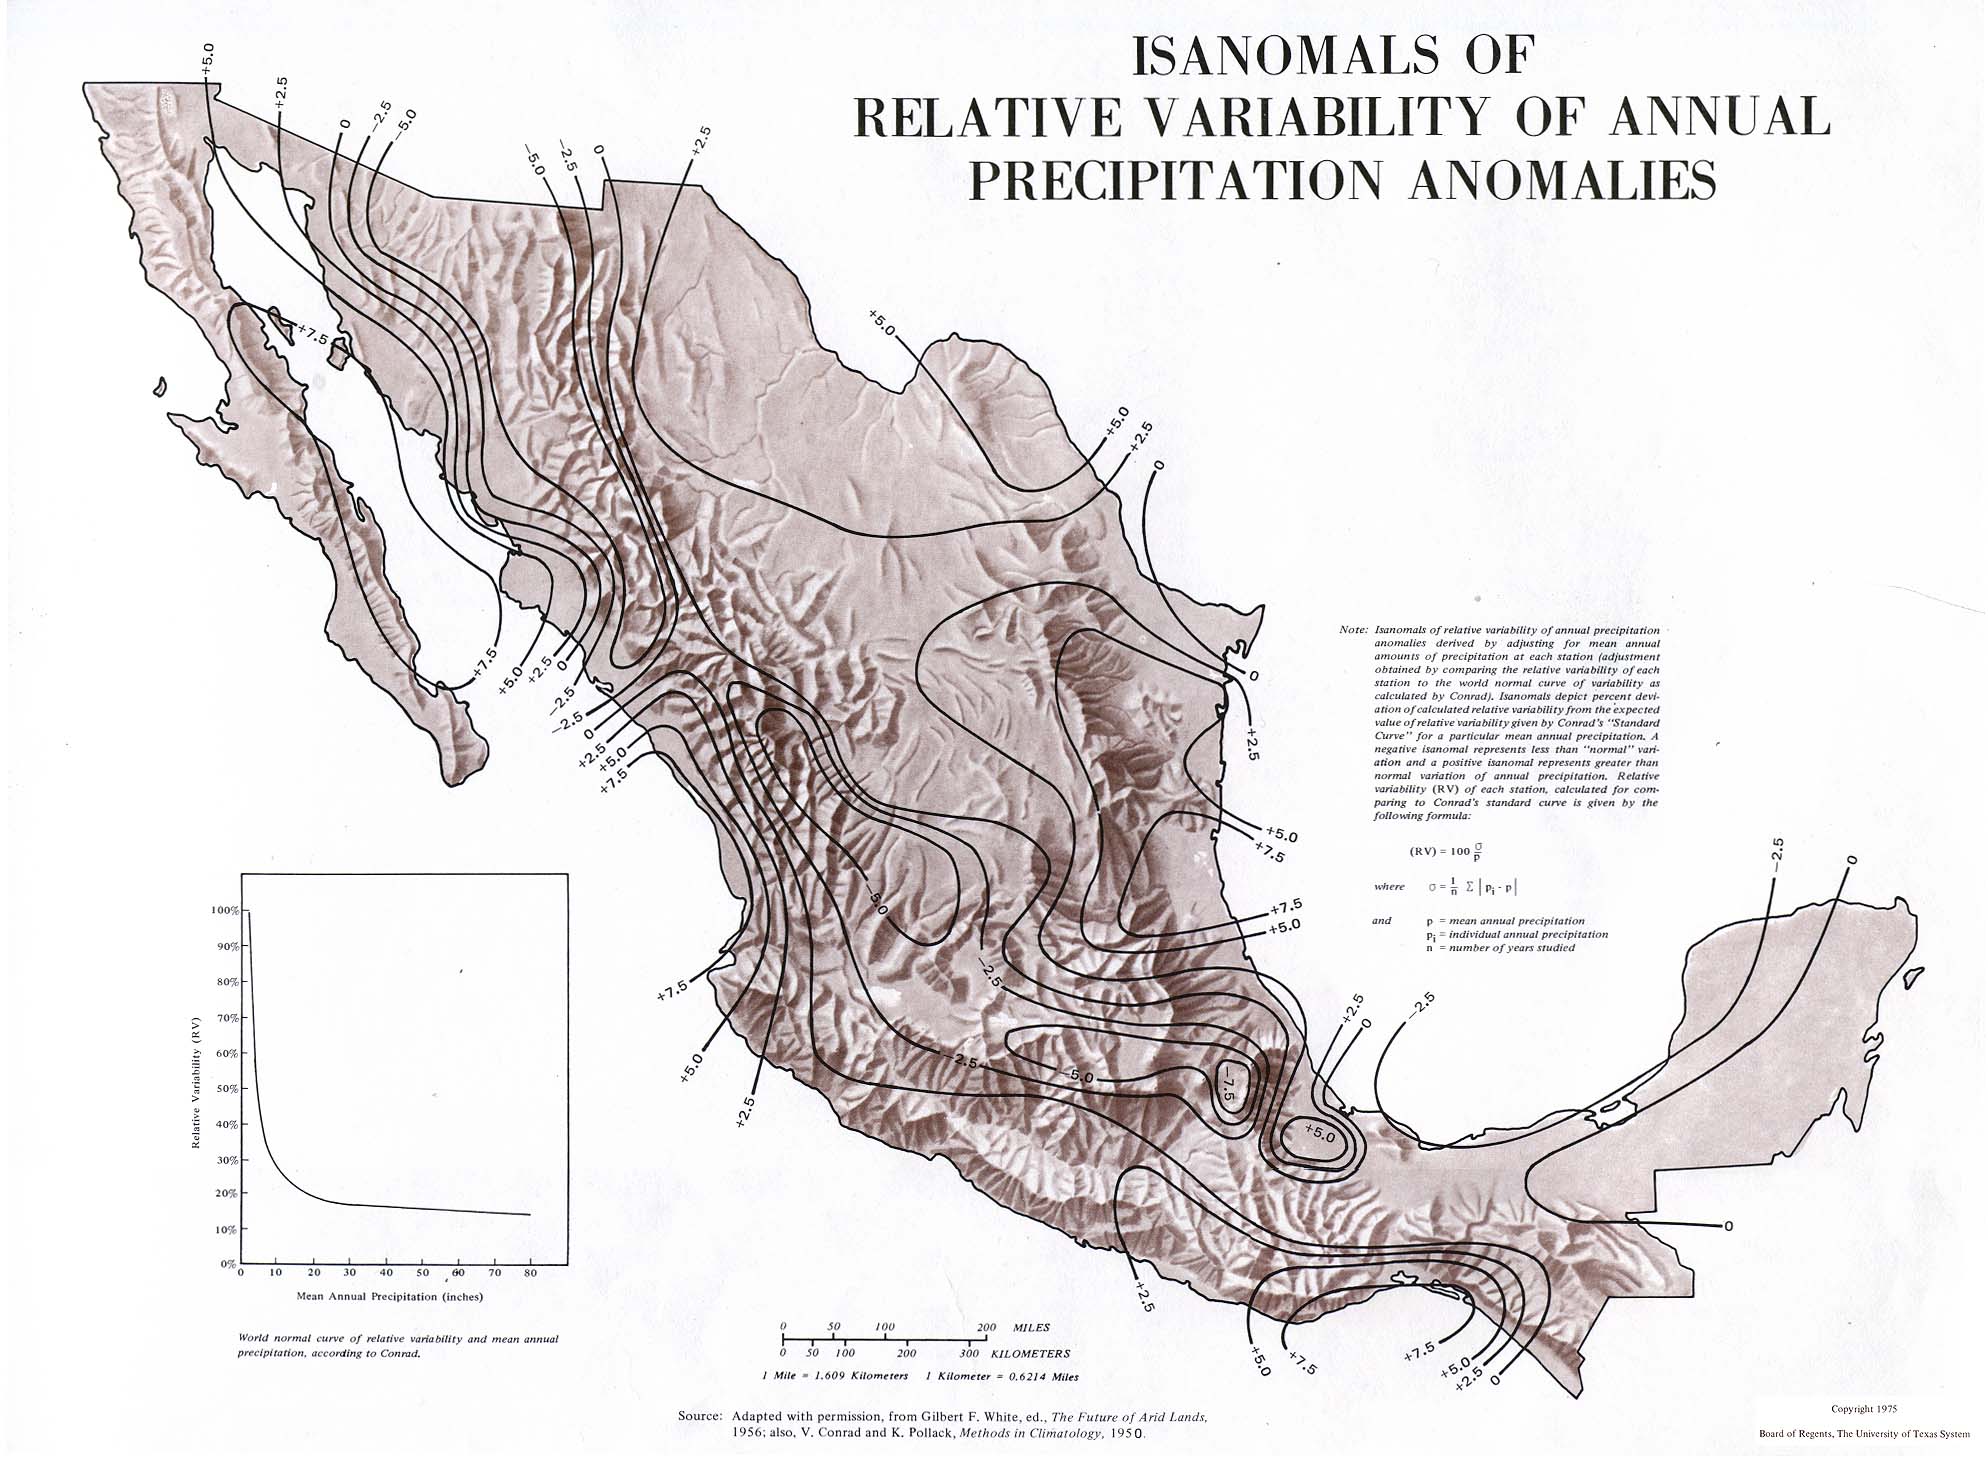
Isanomals of Relative Variability of Annual Precipitation Anomalies (304K)
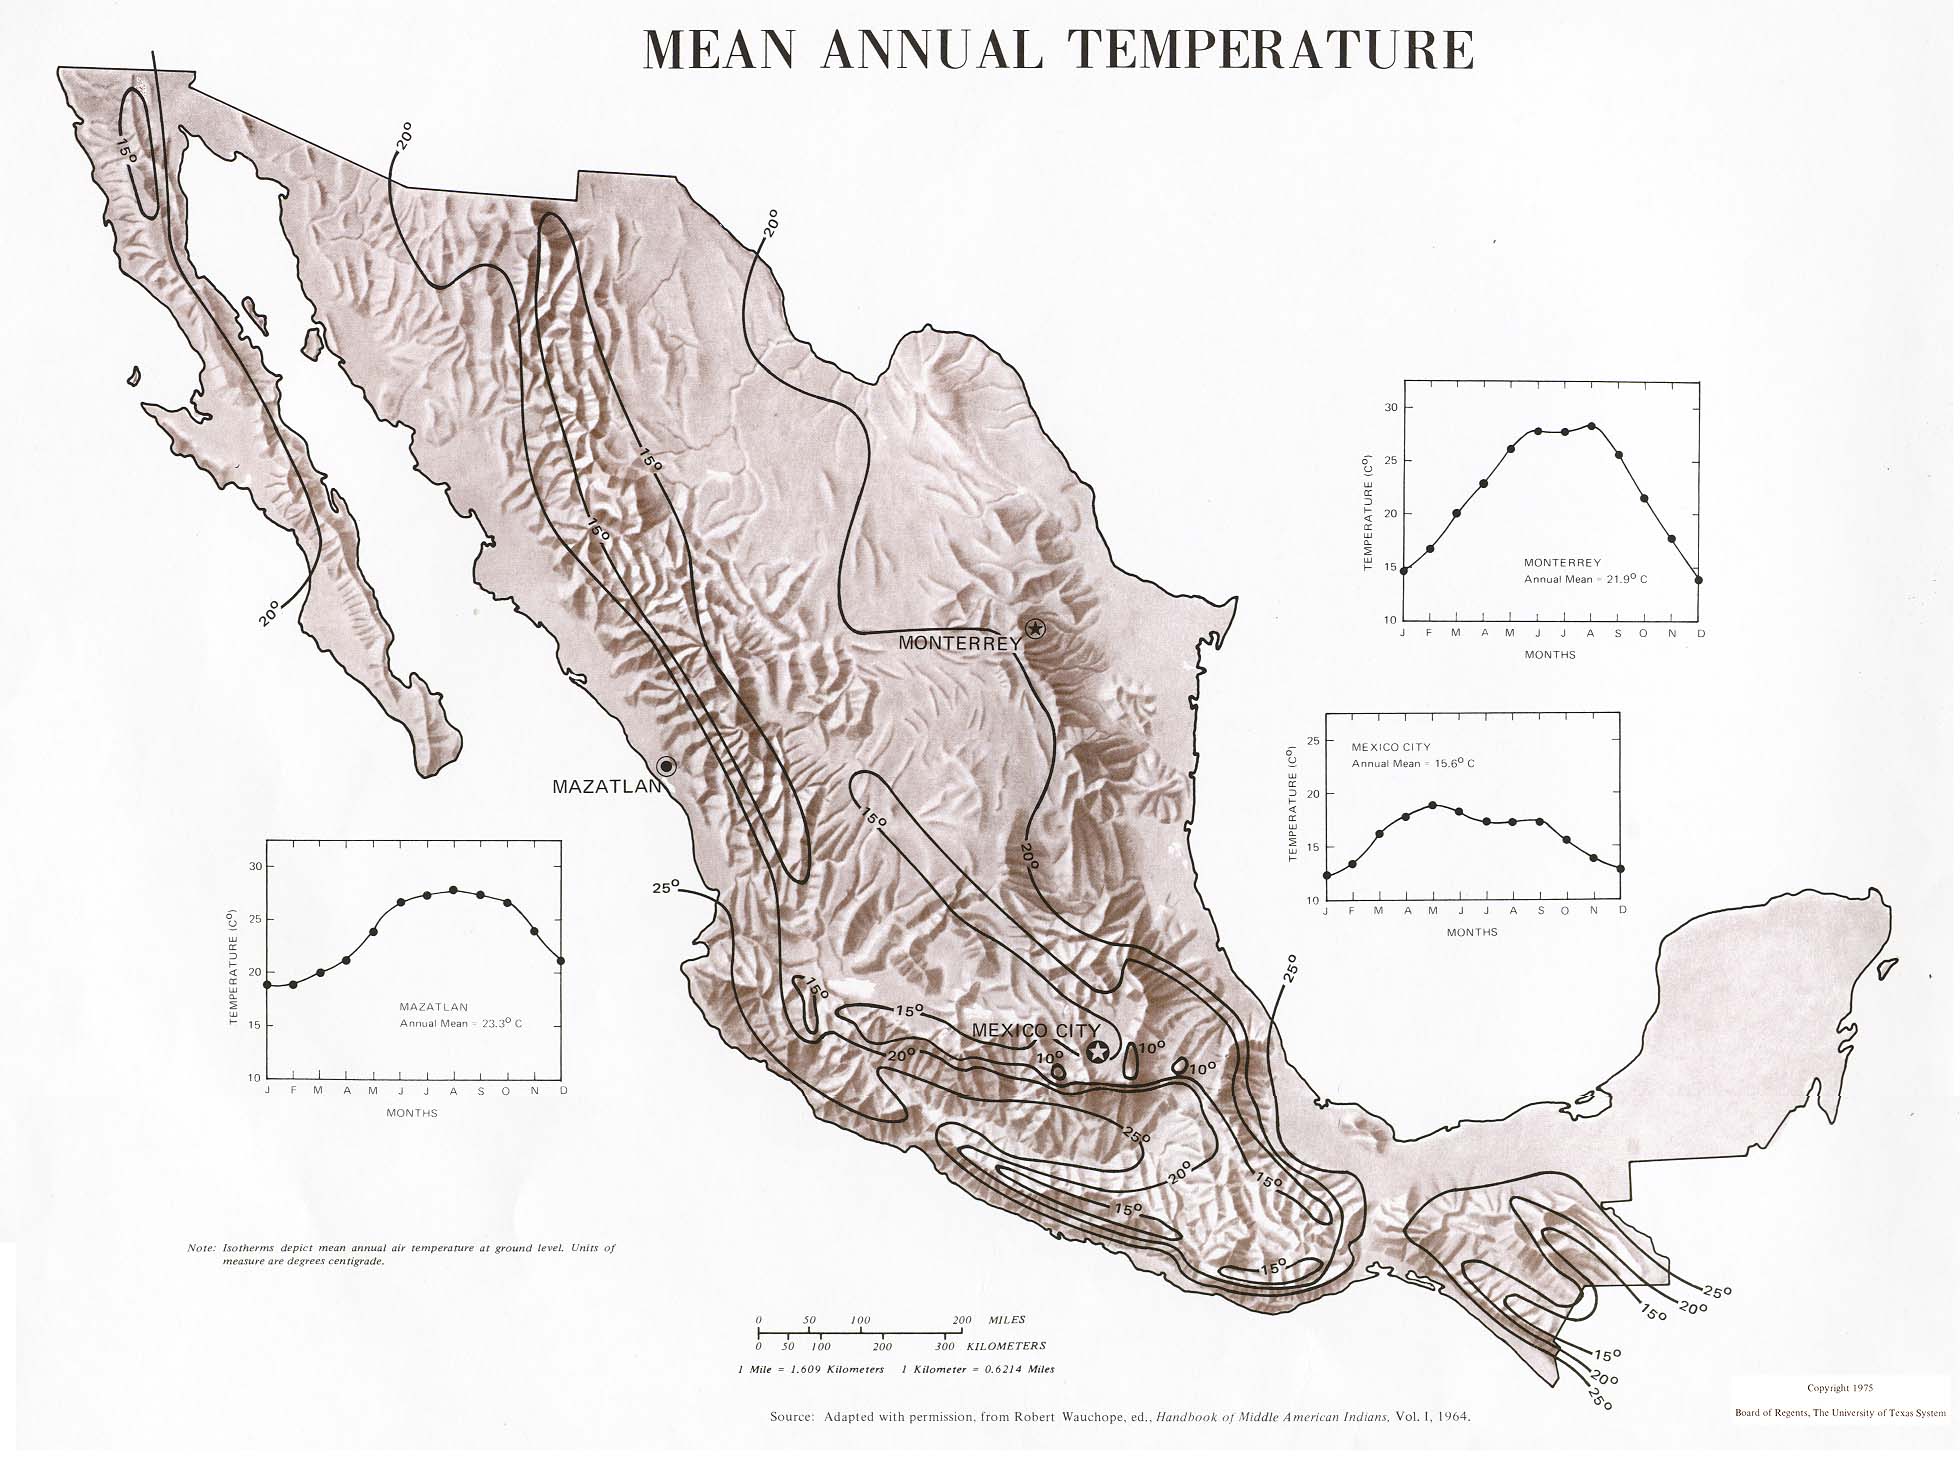
Mean Annual Temperature (252K)
Noted Archeological Sites (326K)
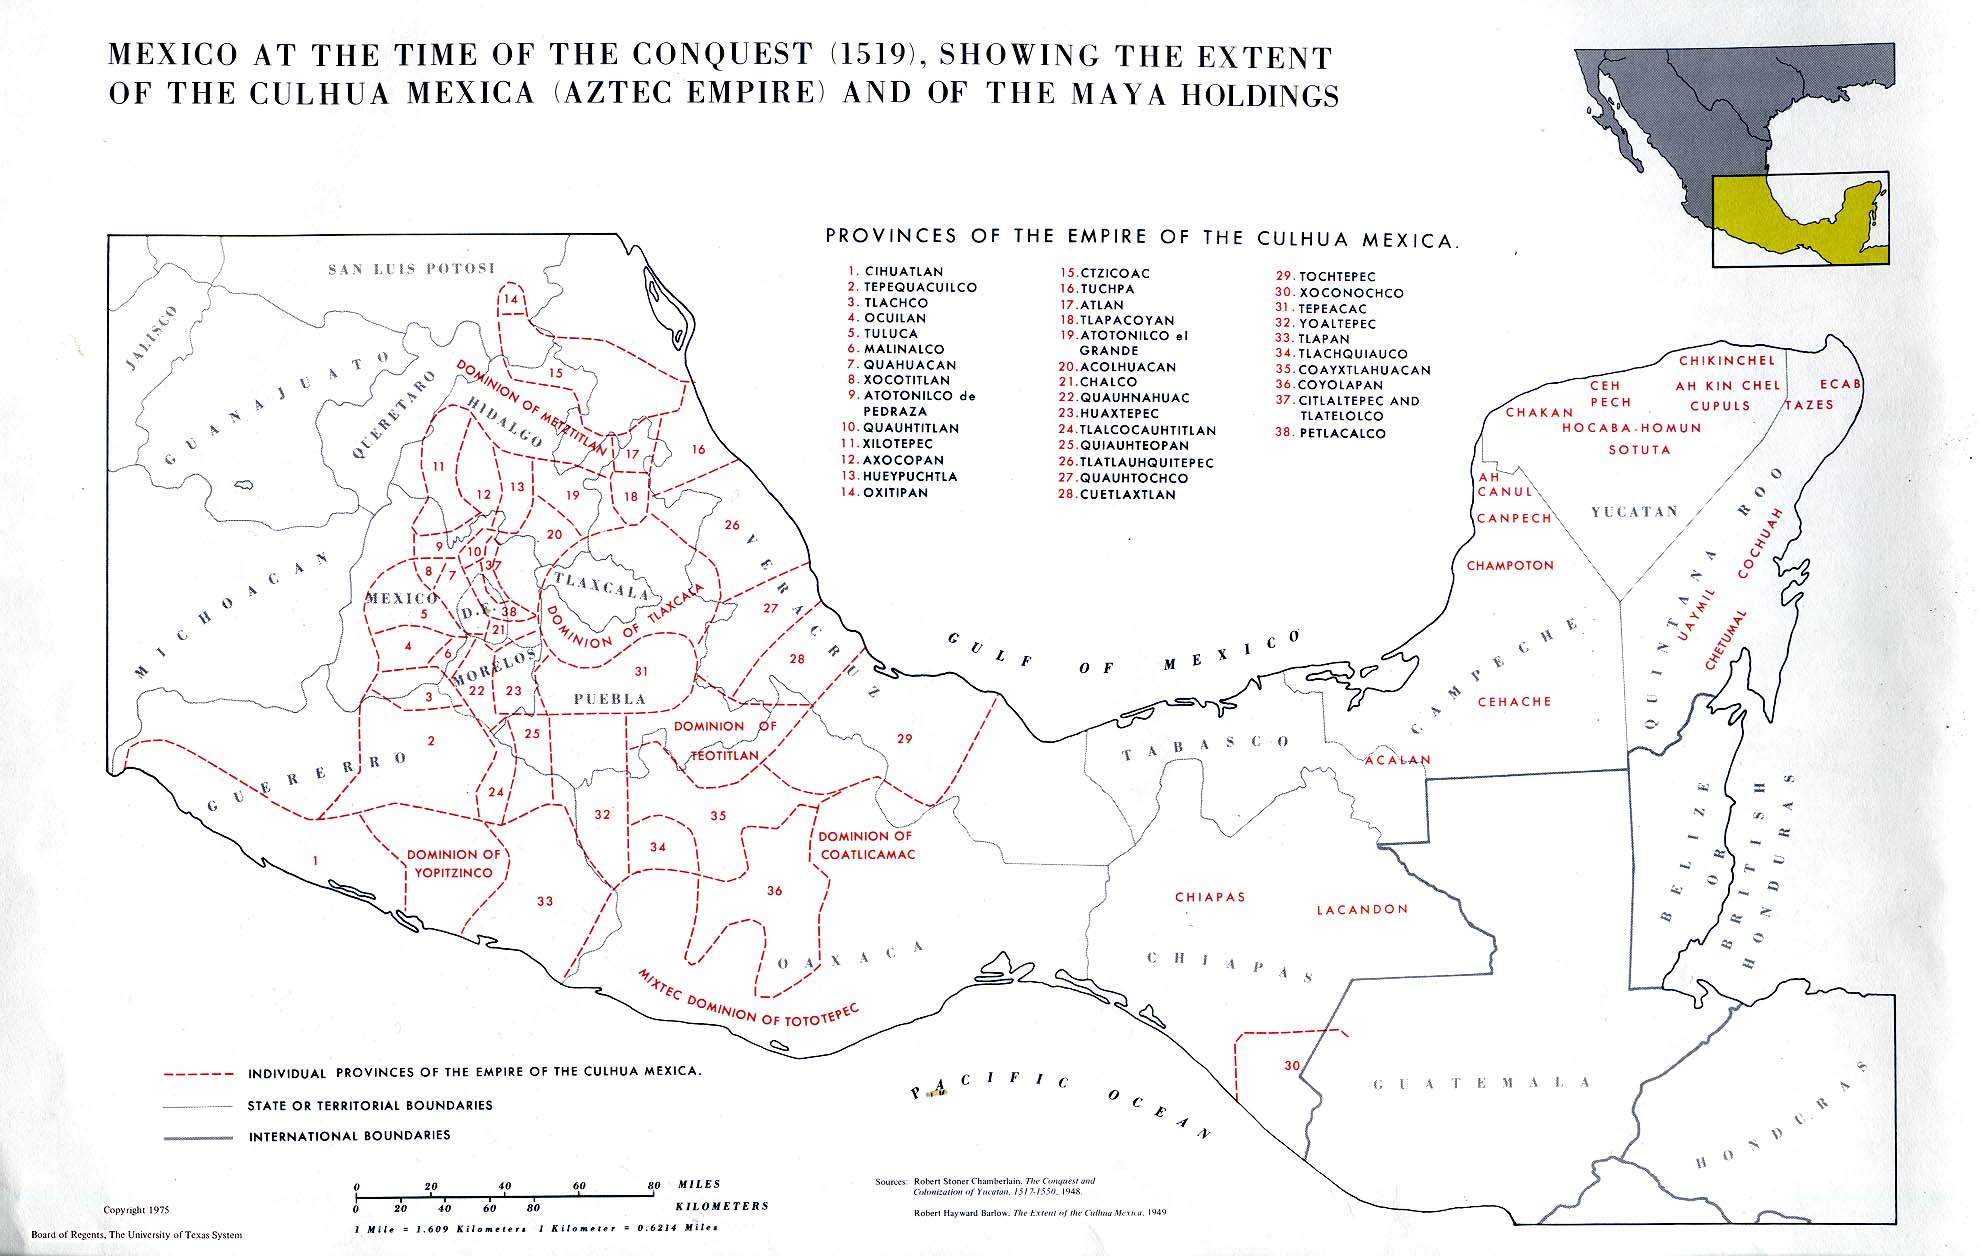
Mexico at the Time of Conquest, 1519 (291K)
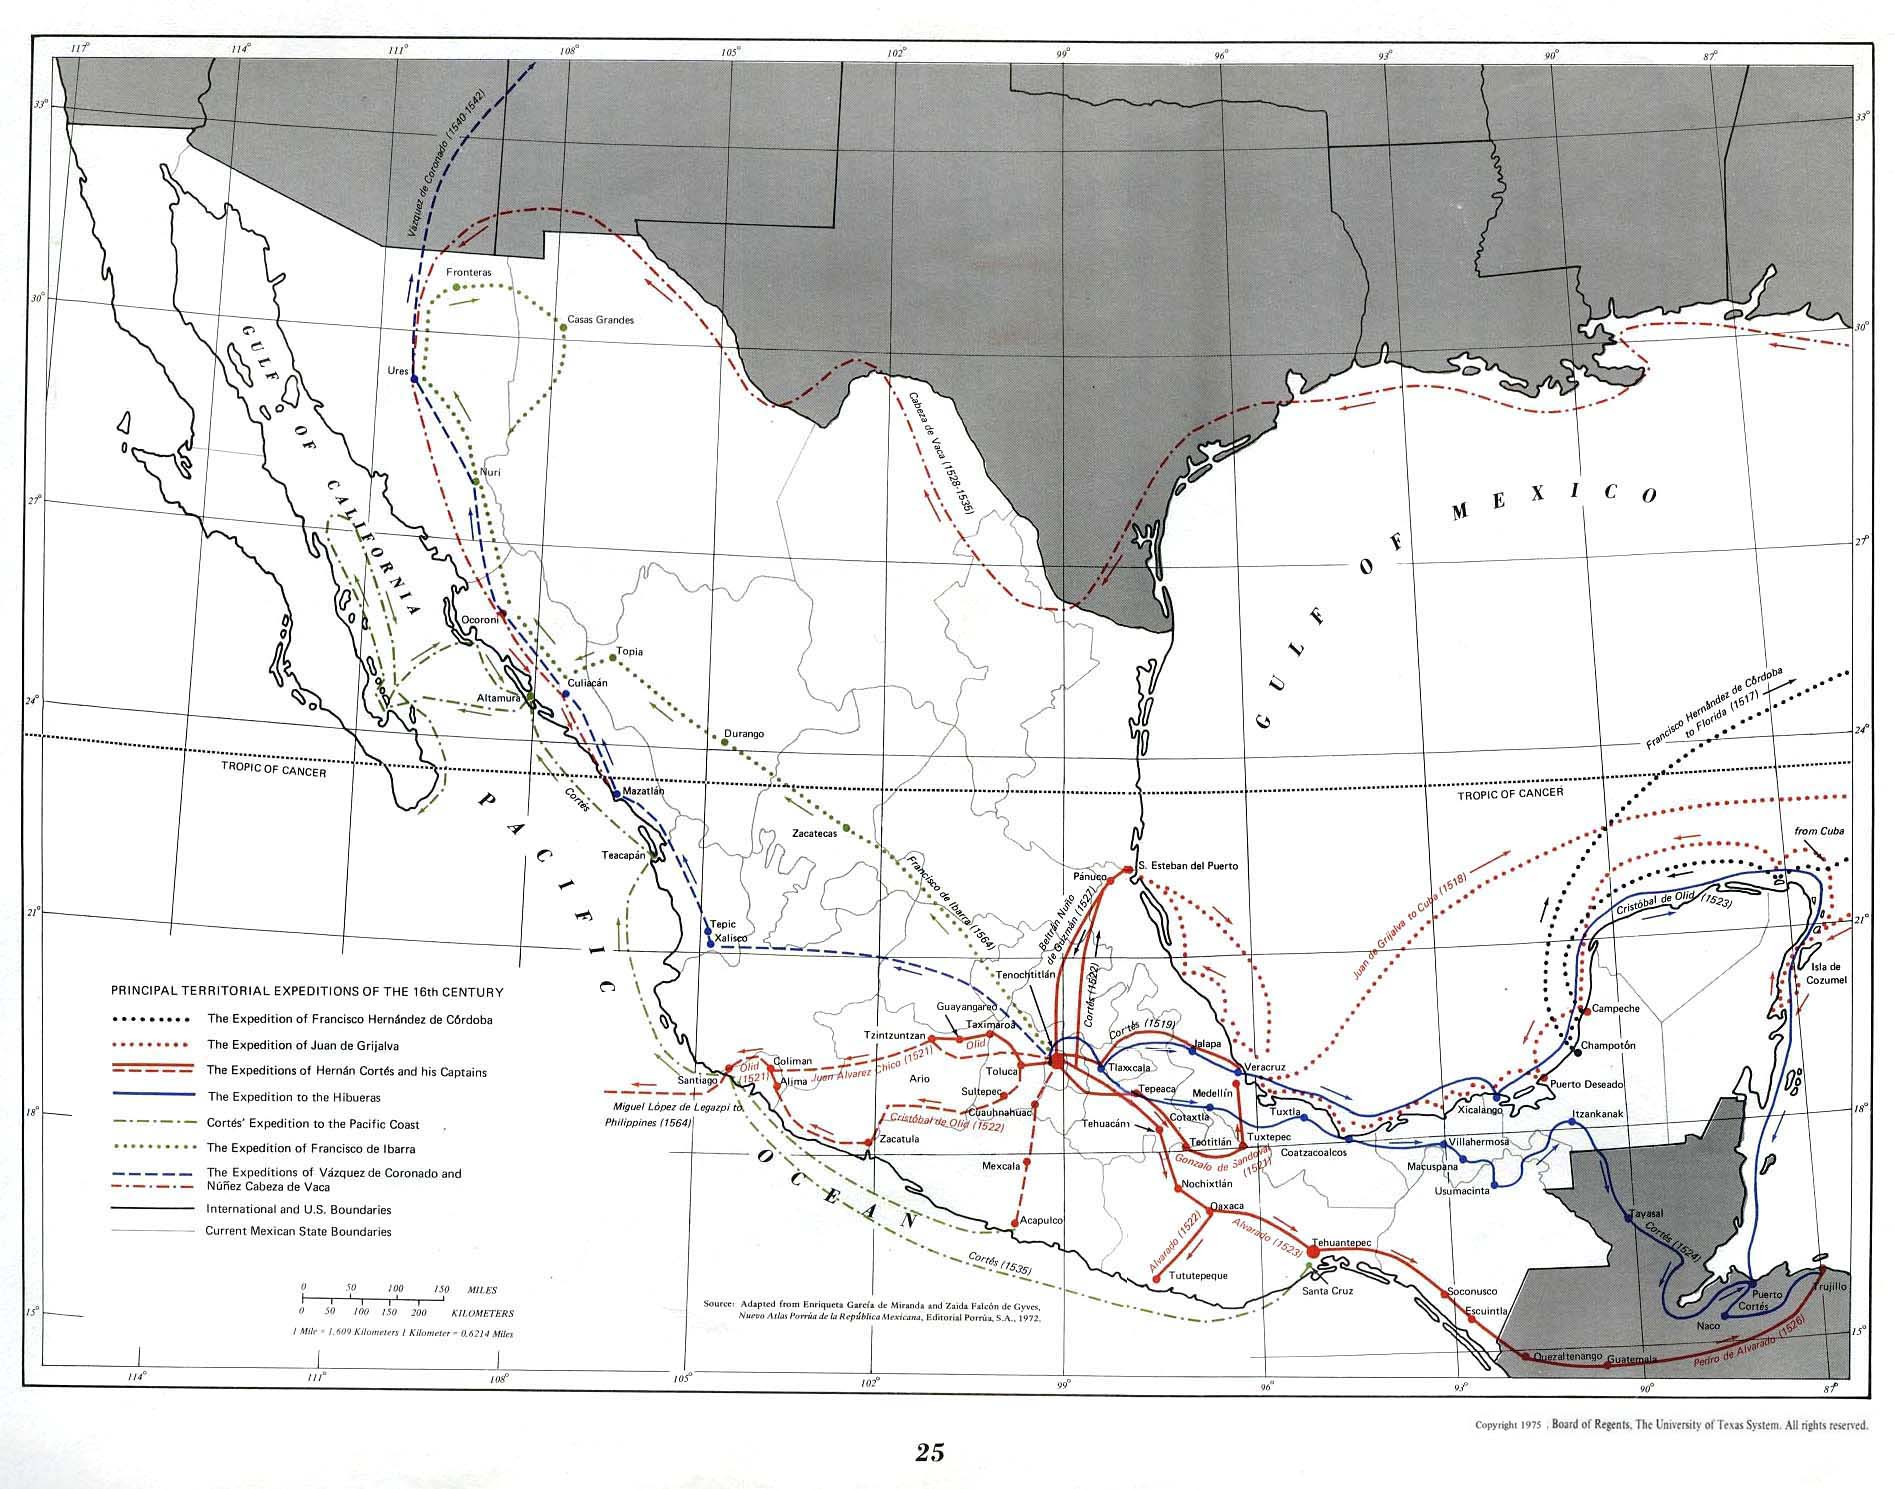
Principal Territorial Expeditions of the 16th Century (334K)
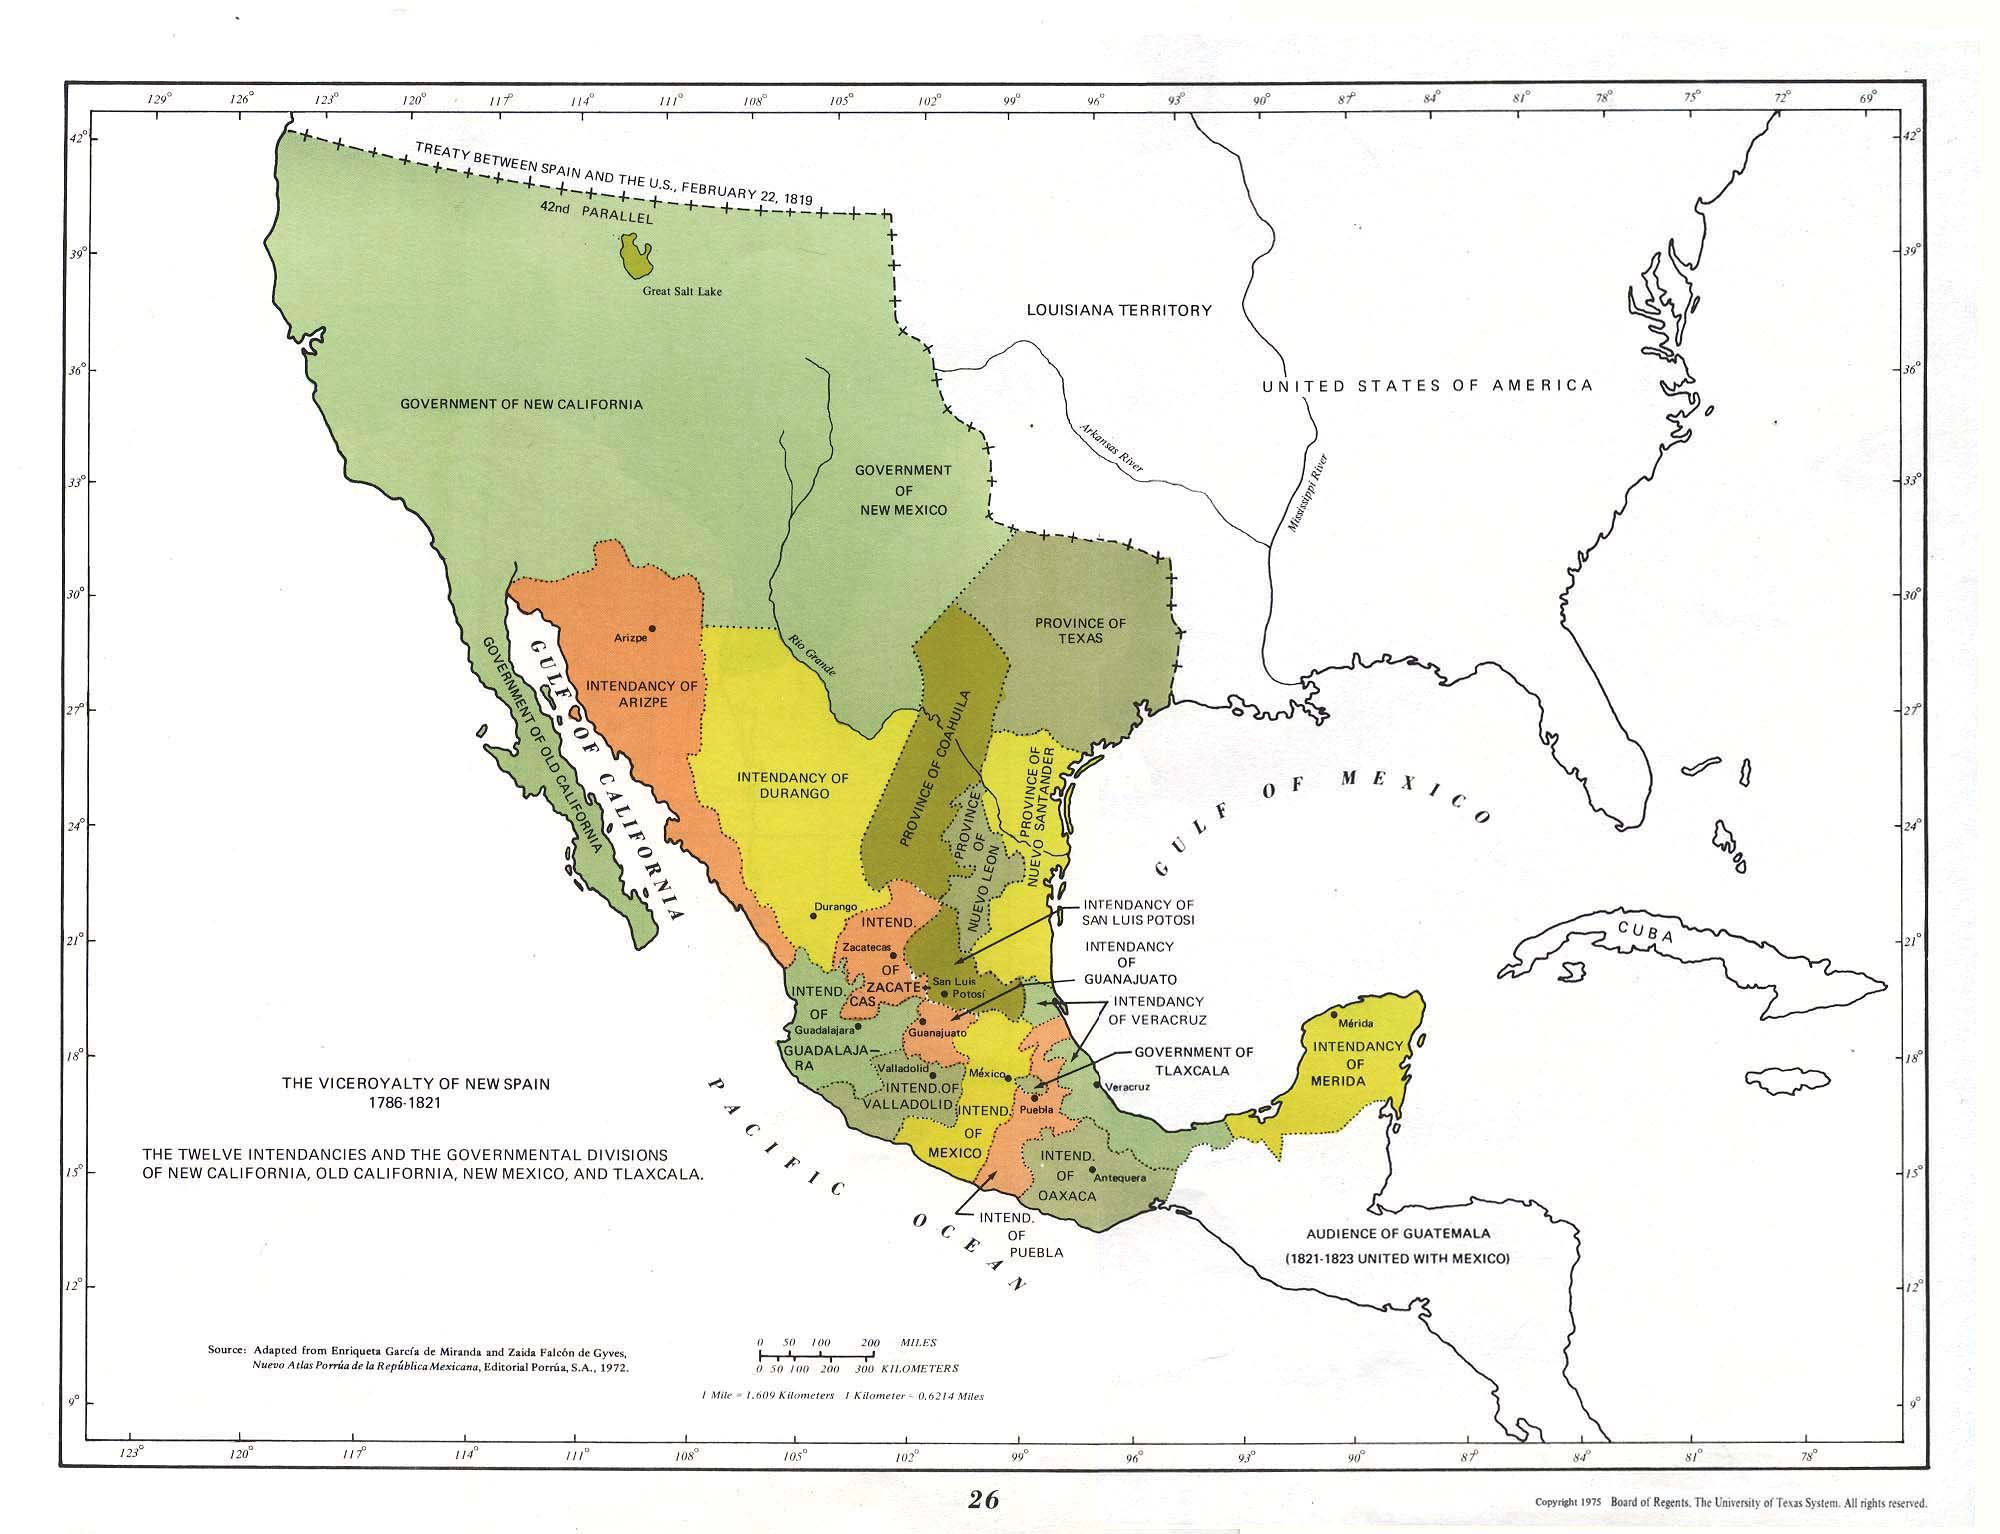
The Viceroyalty of New Spain 1786-1821 (238K)
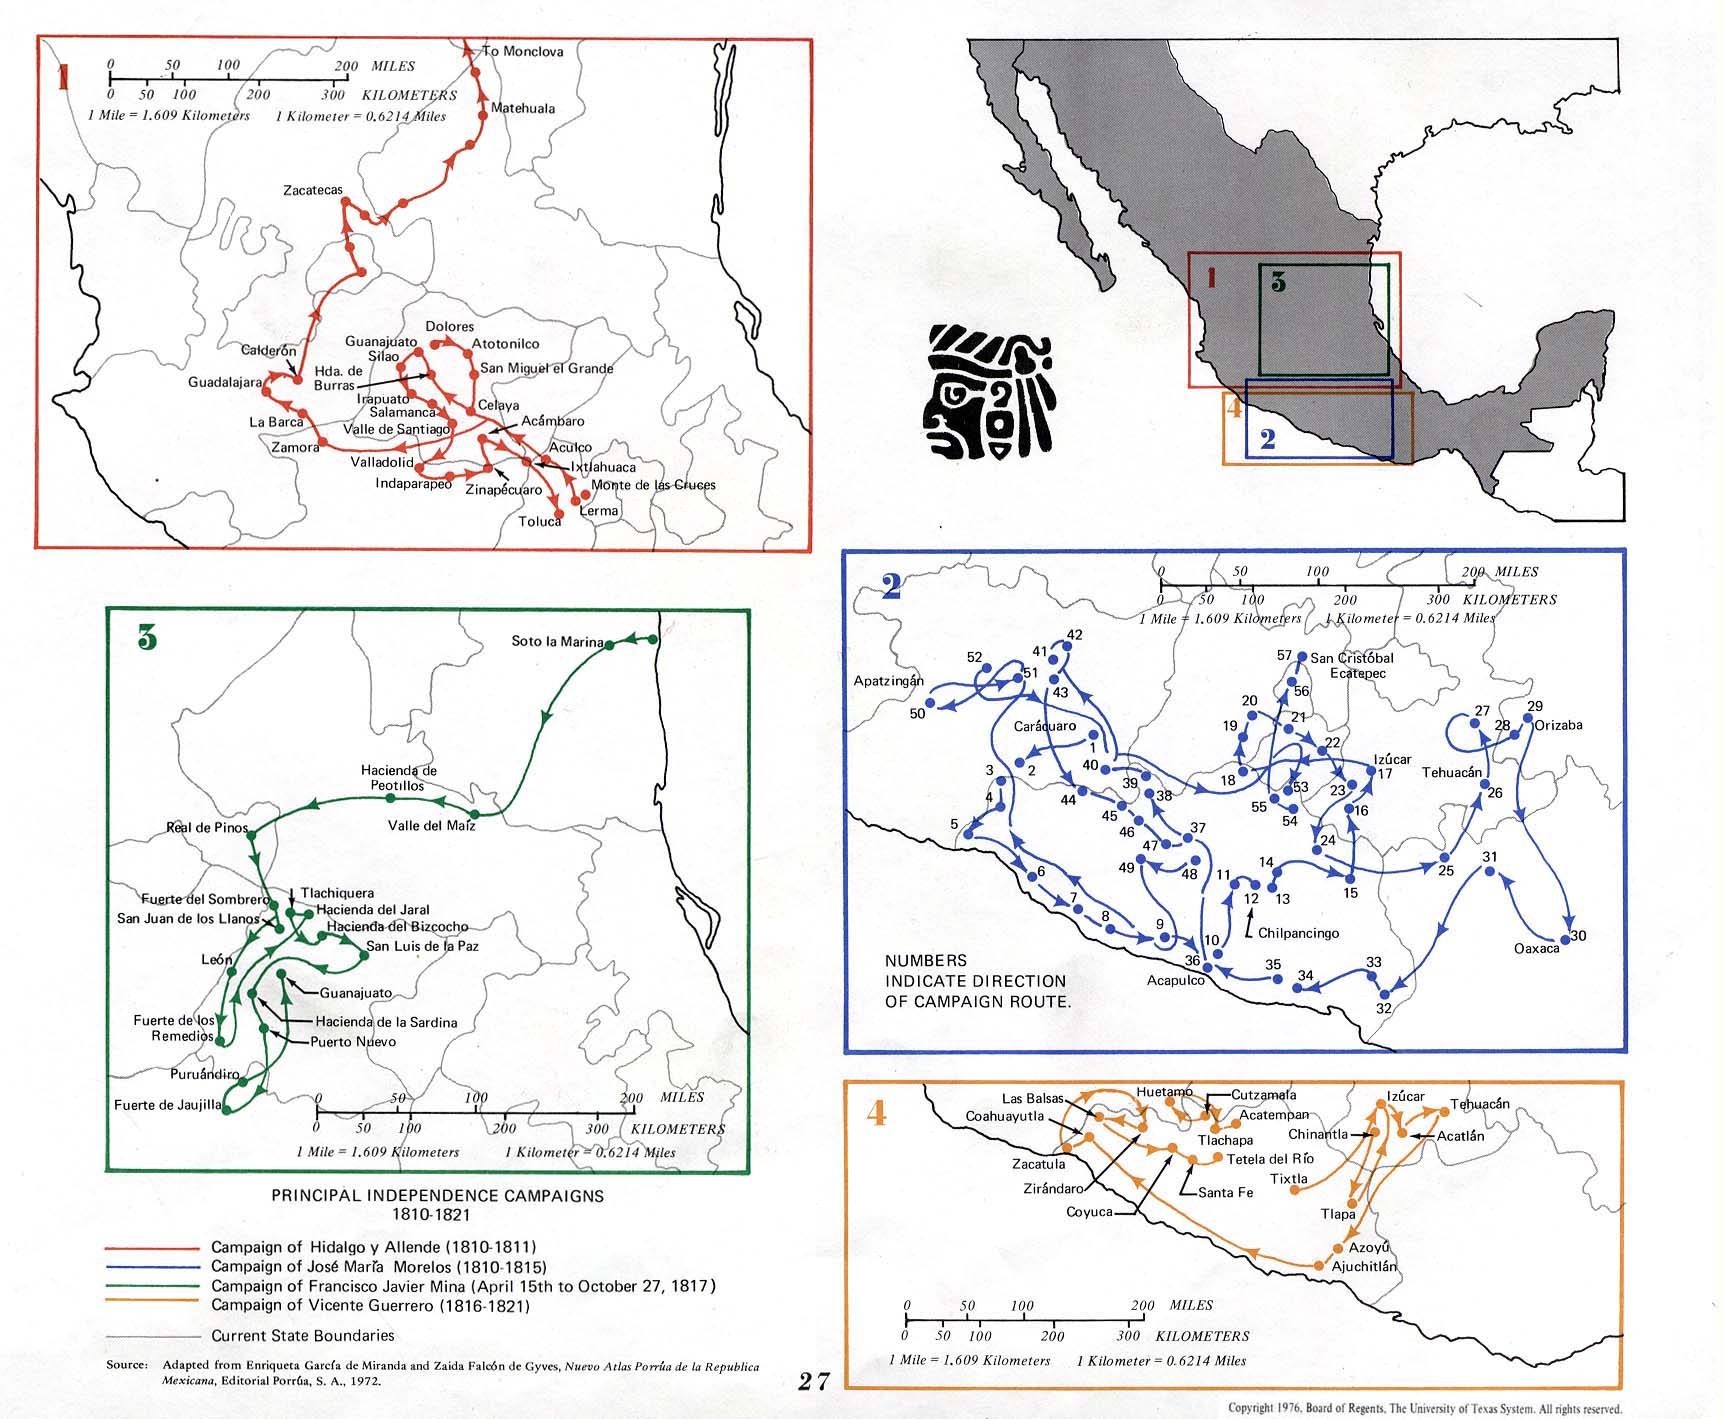
Principal Independence Campaigns 1810-1821 (299K)
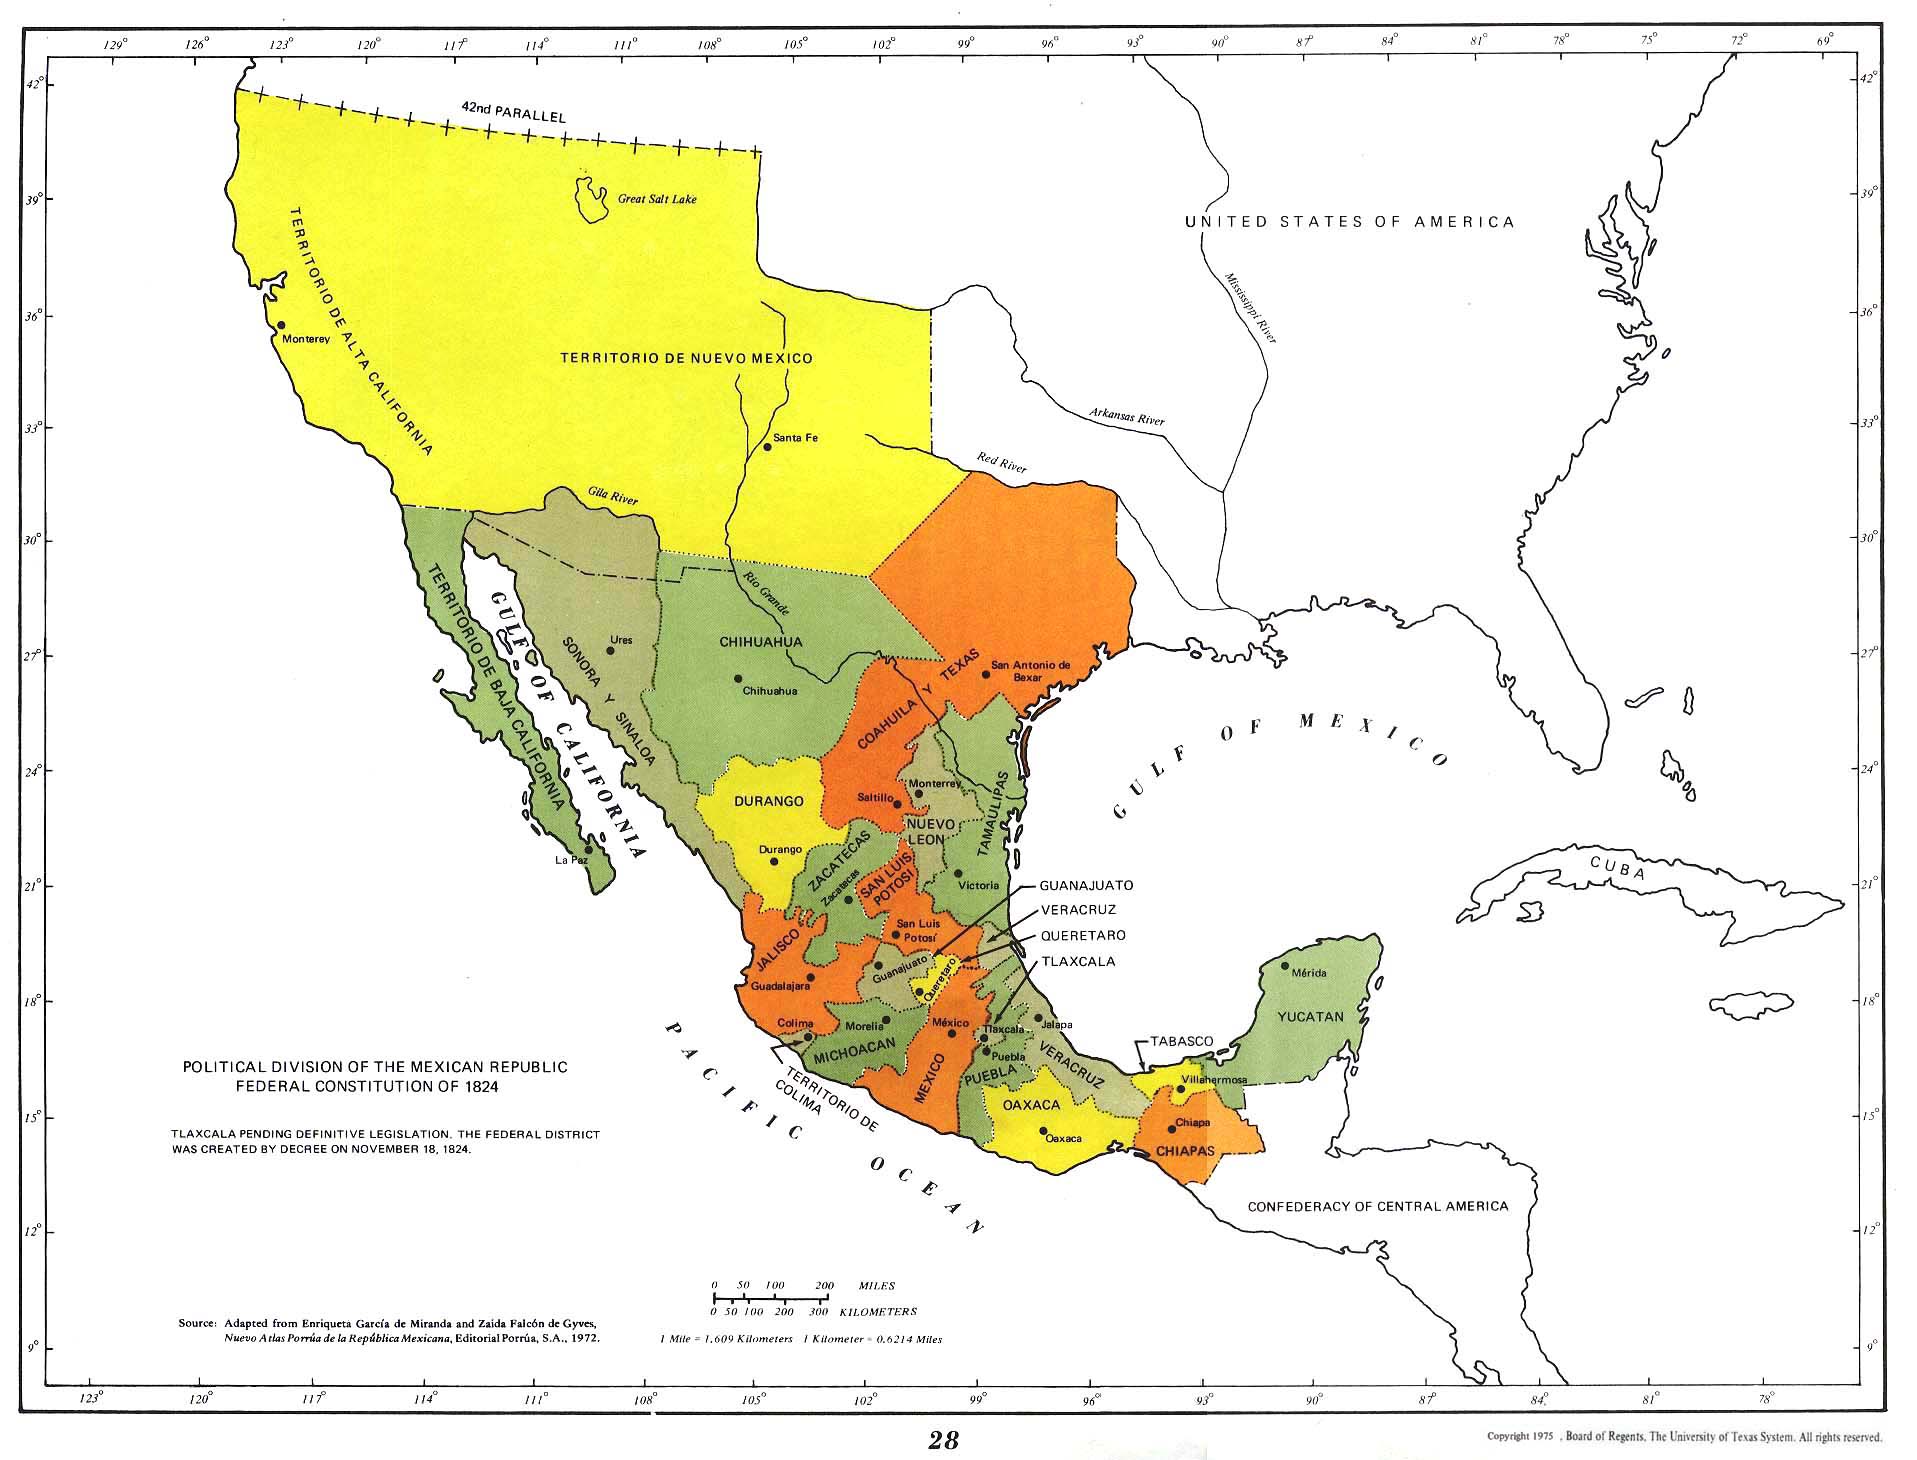
Political Divisions of the Mexican Republic Federal Constitiution of 1824 (236K)
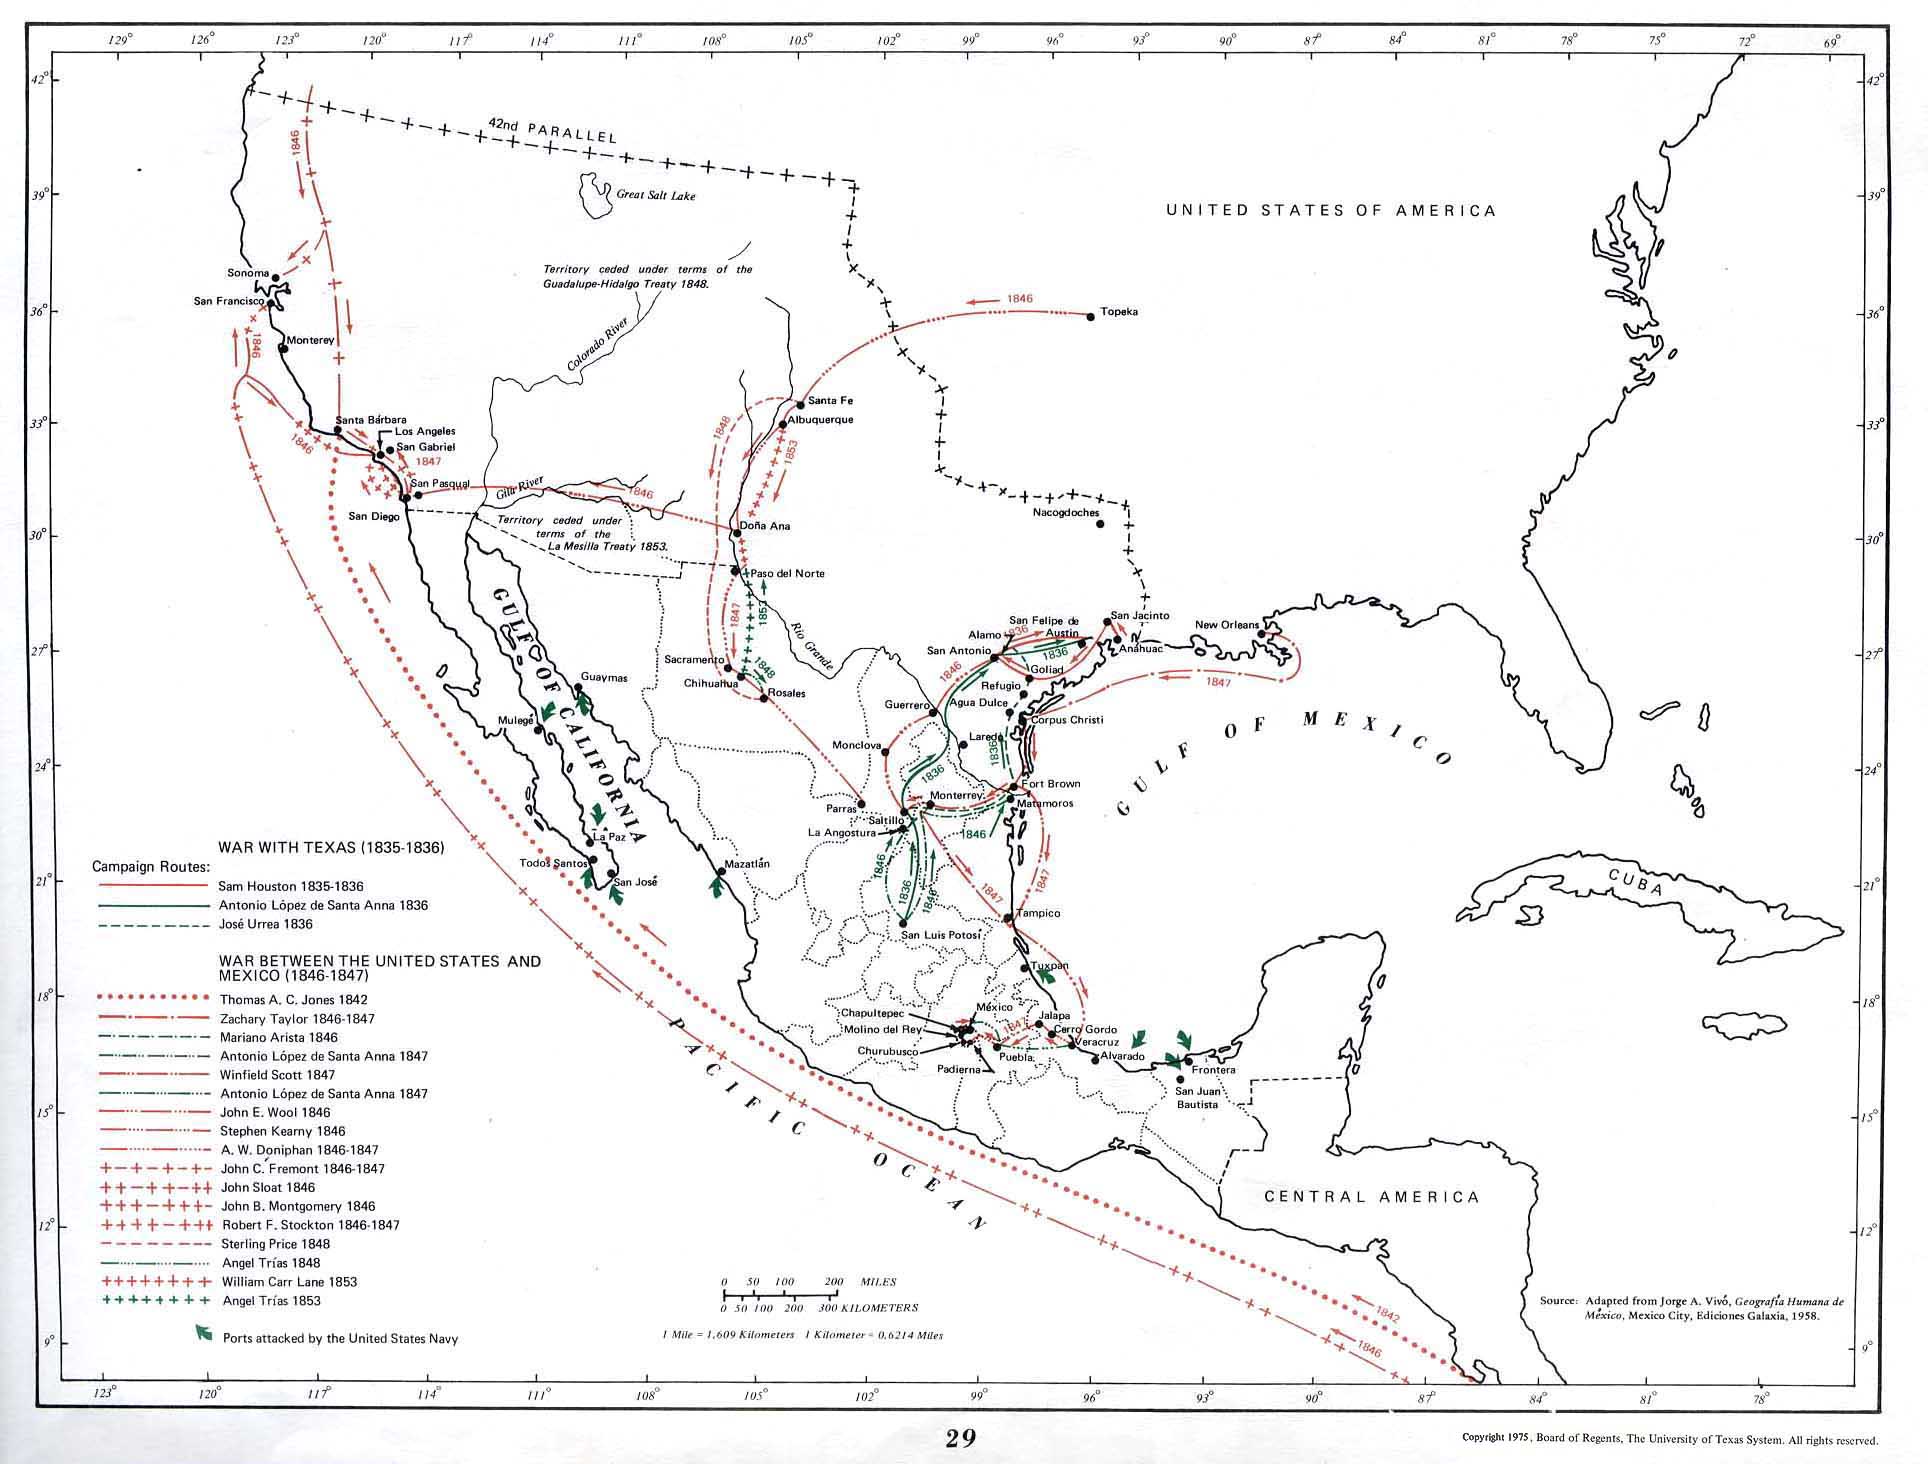
War with Texas (1835-1836) (241K)
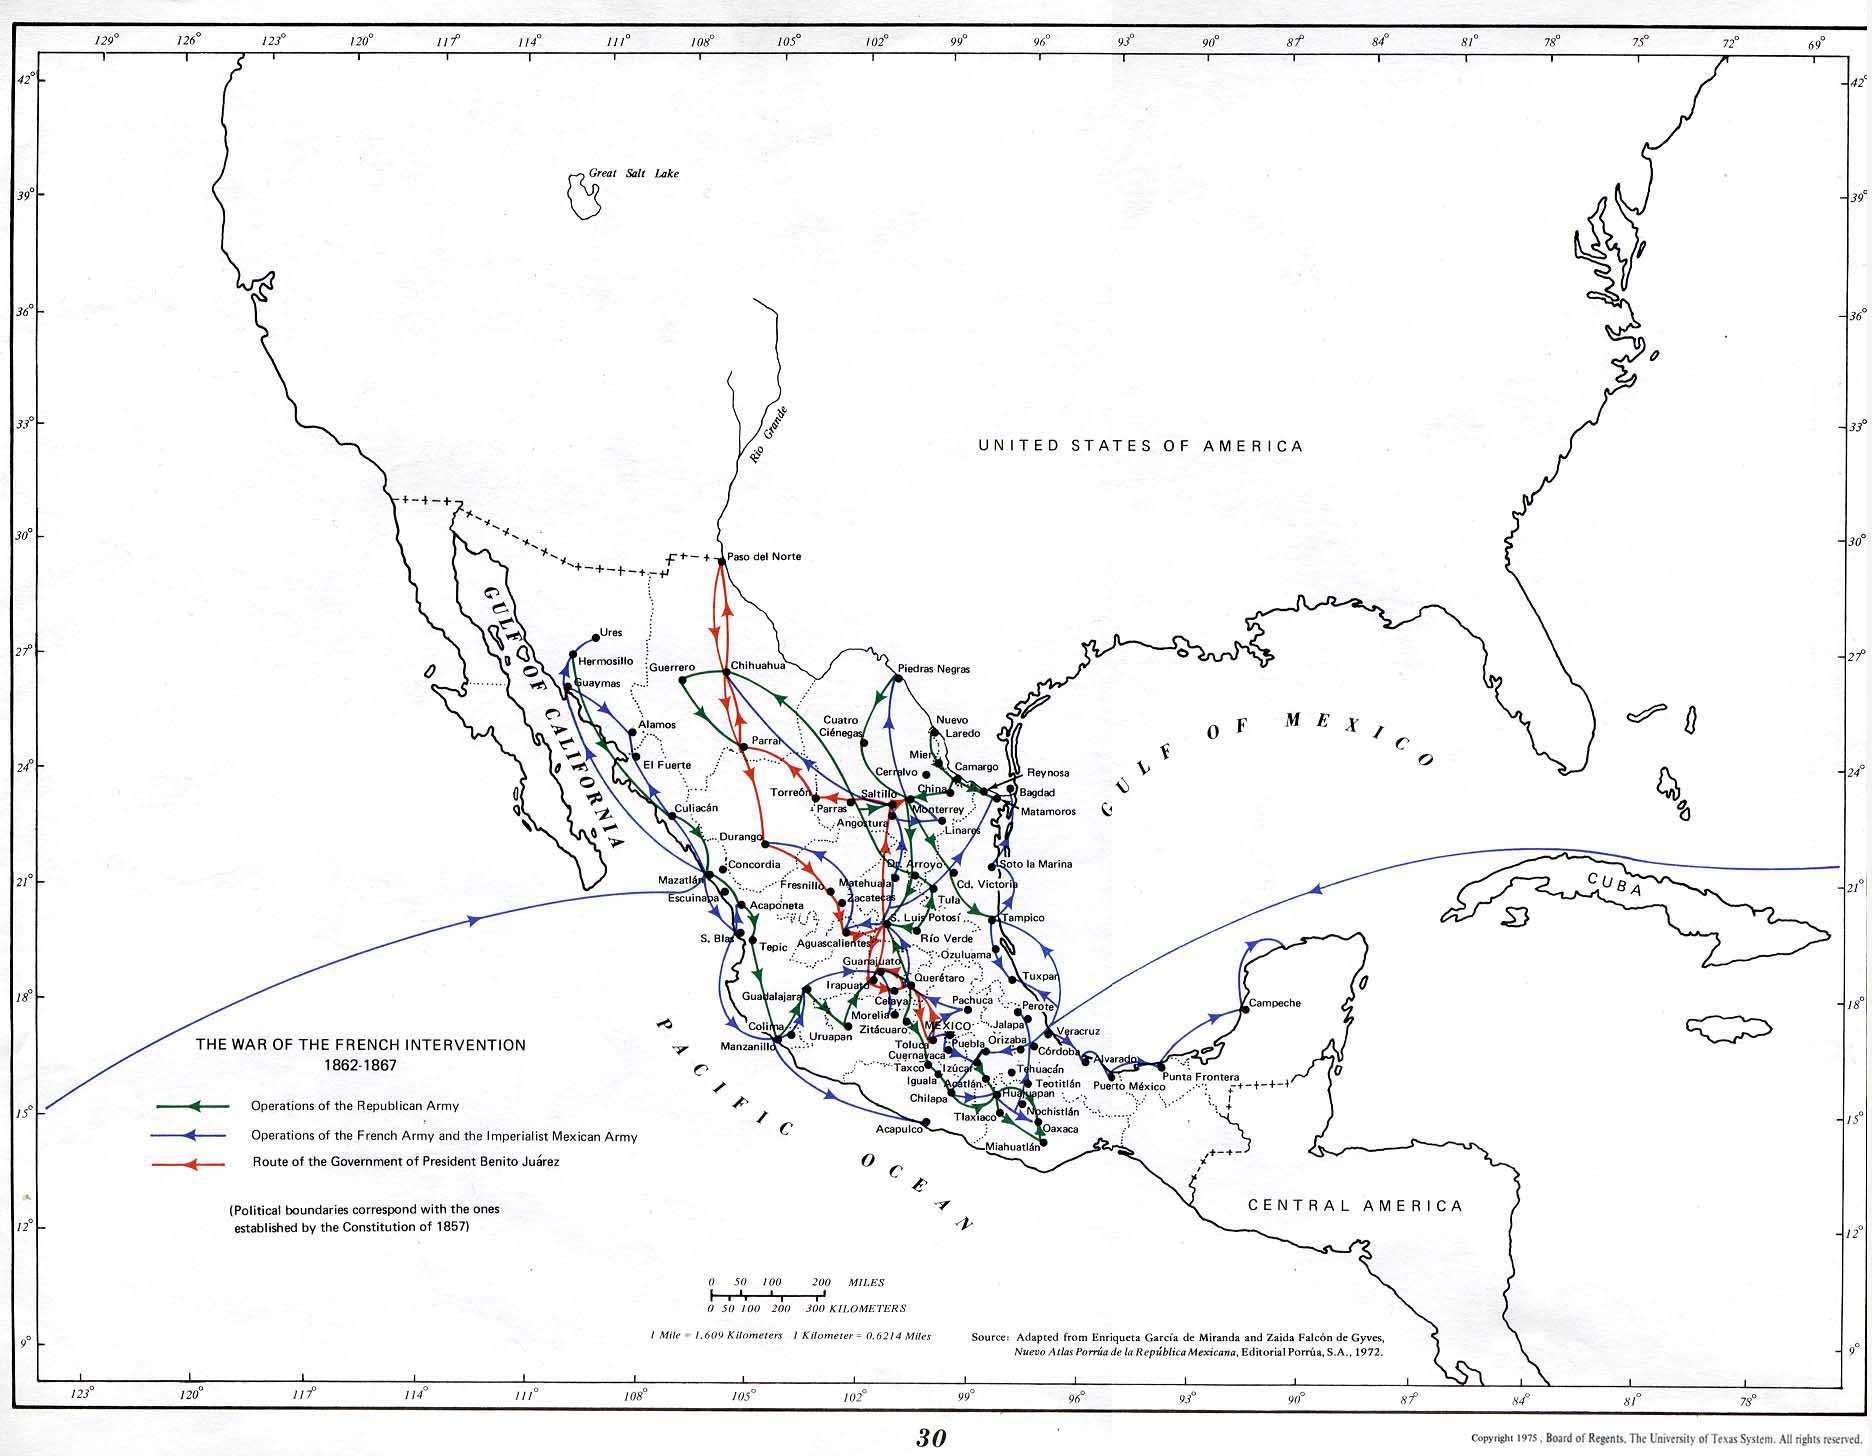
The War of French Intervention 1862-1867 (235K)
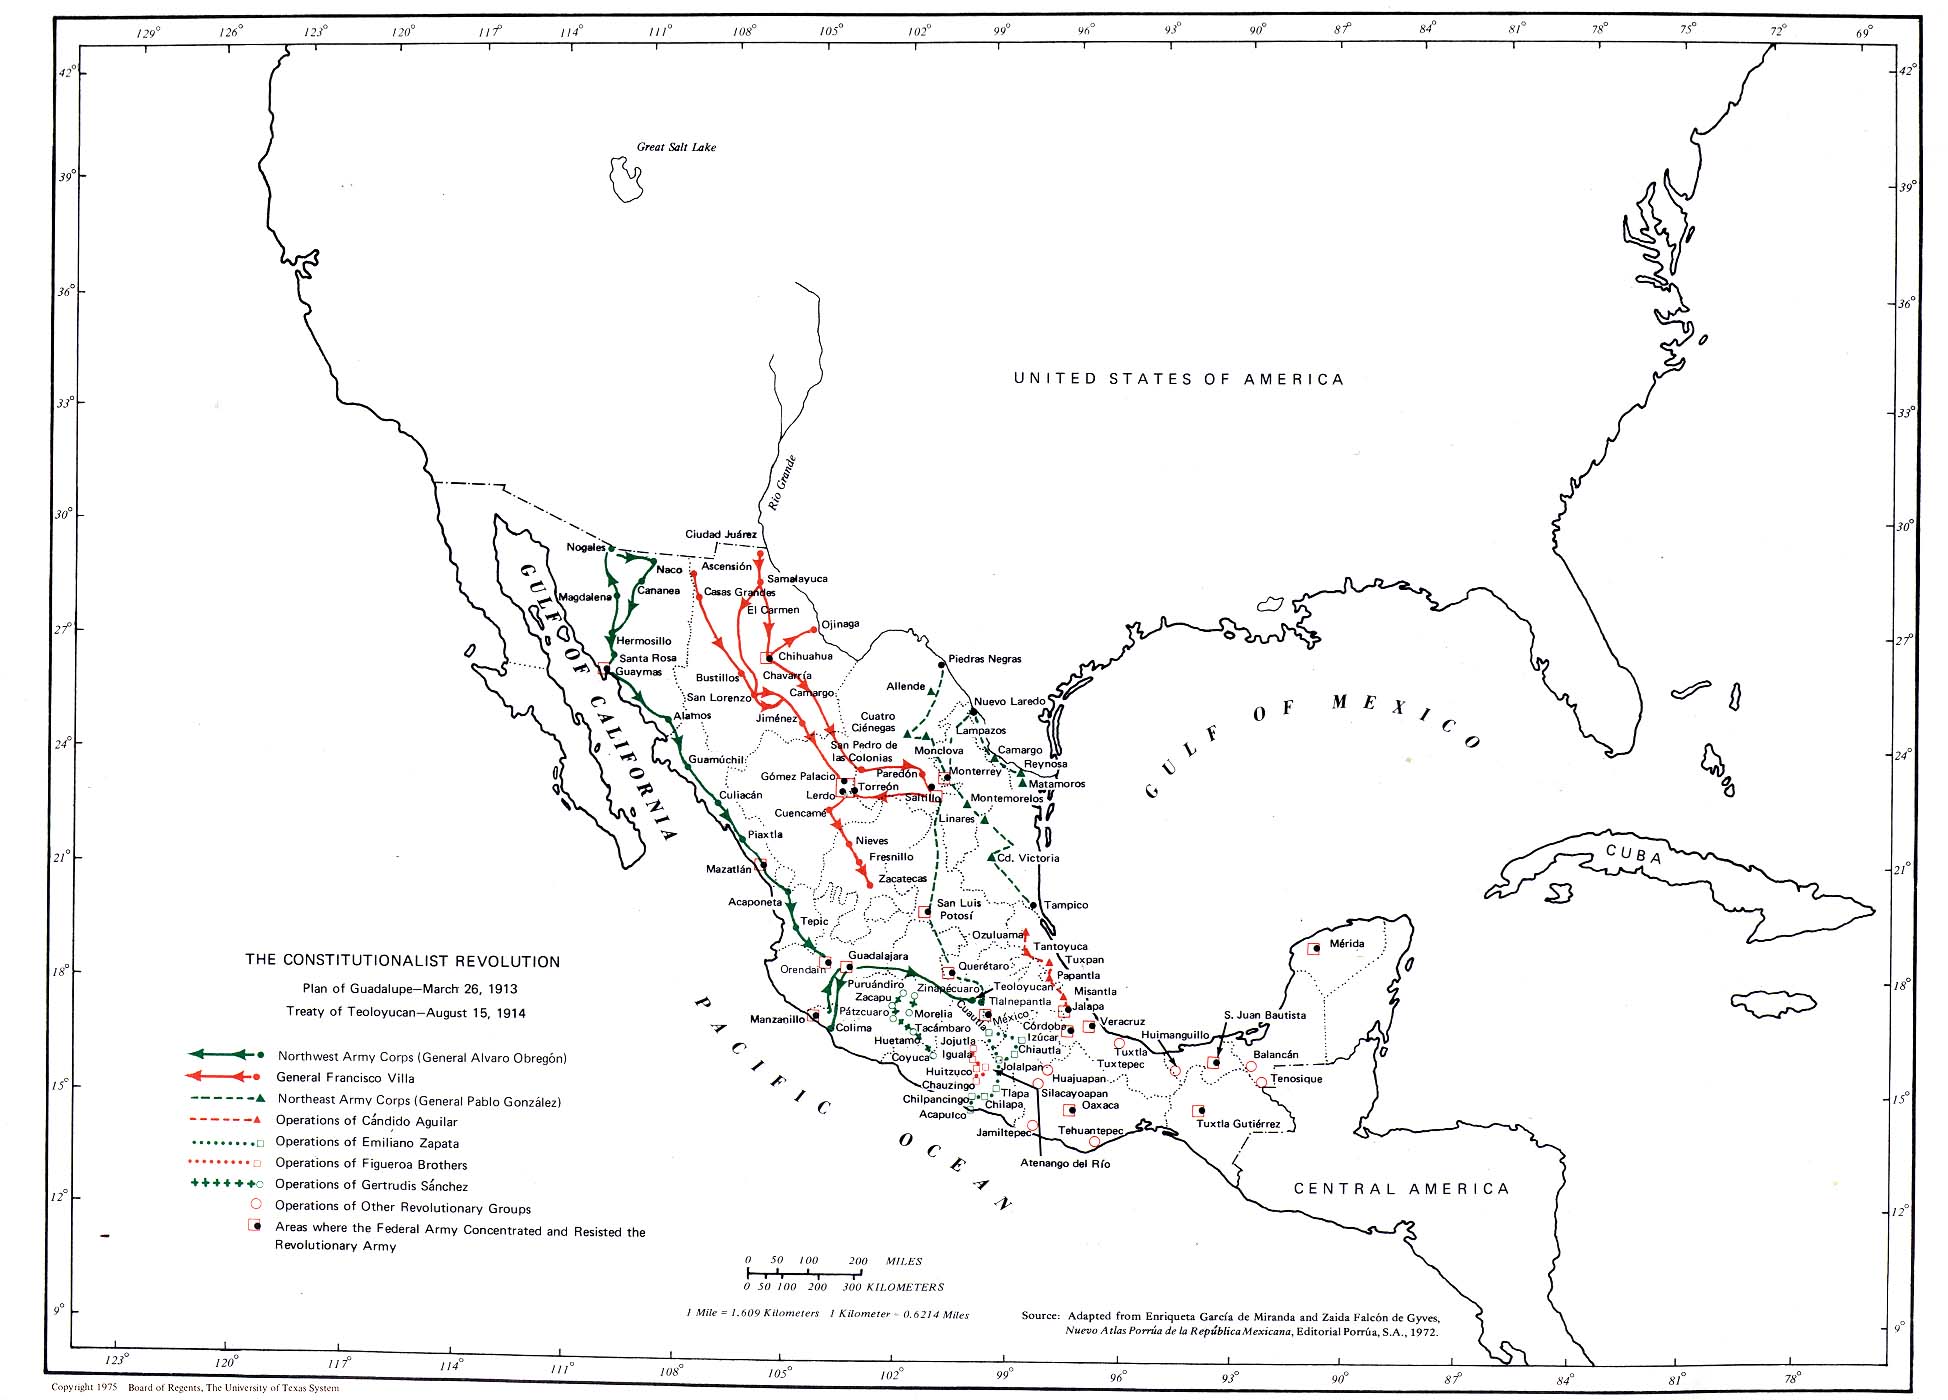
The Constitutionalist Revolution (241K)
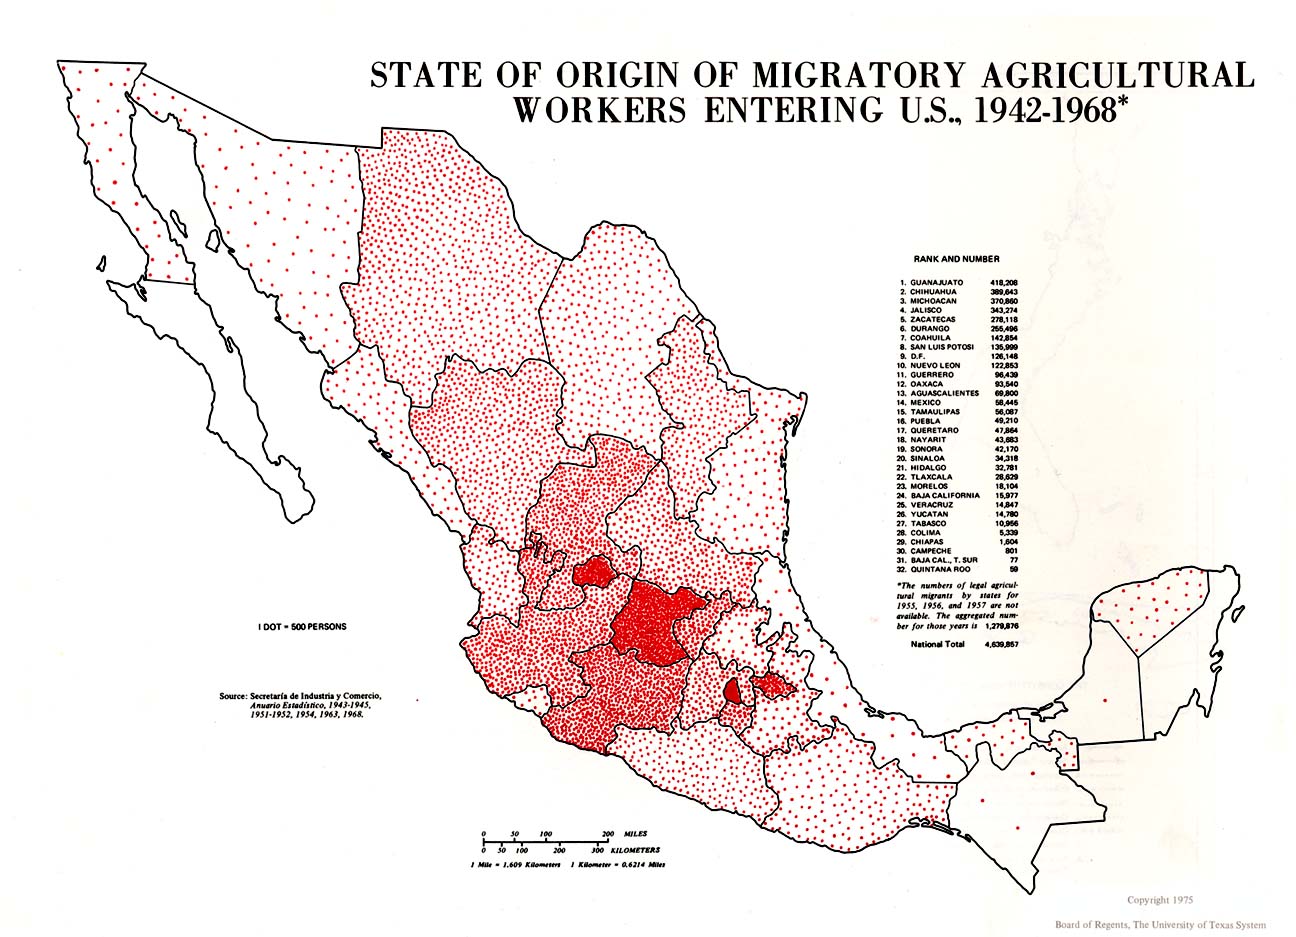
State of Origin of Migratory Agricultural Workers Entering U.S., 1942-1968 (241K)
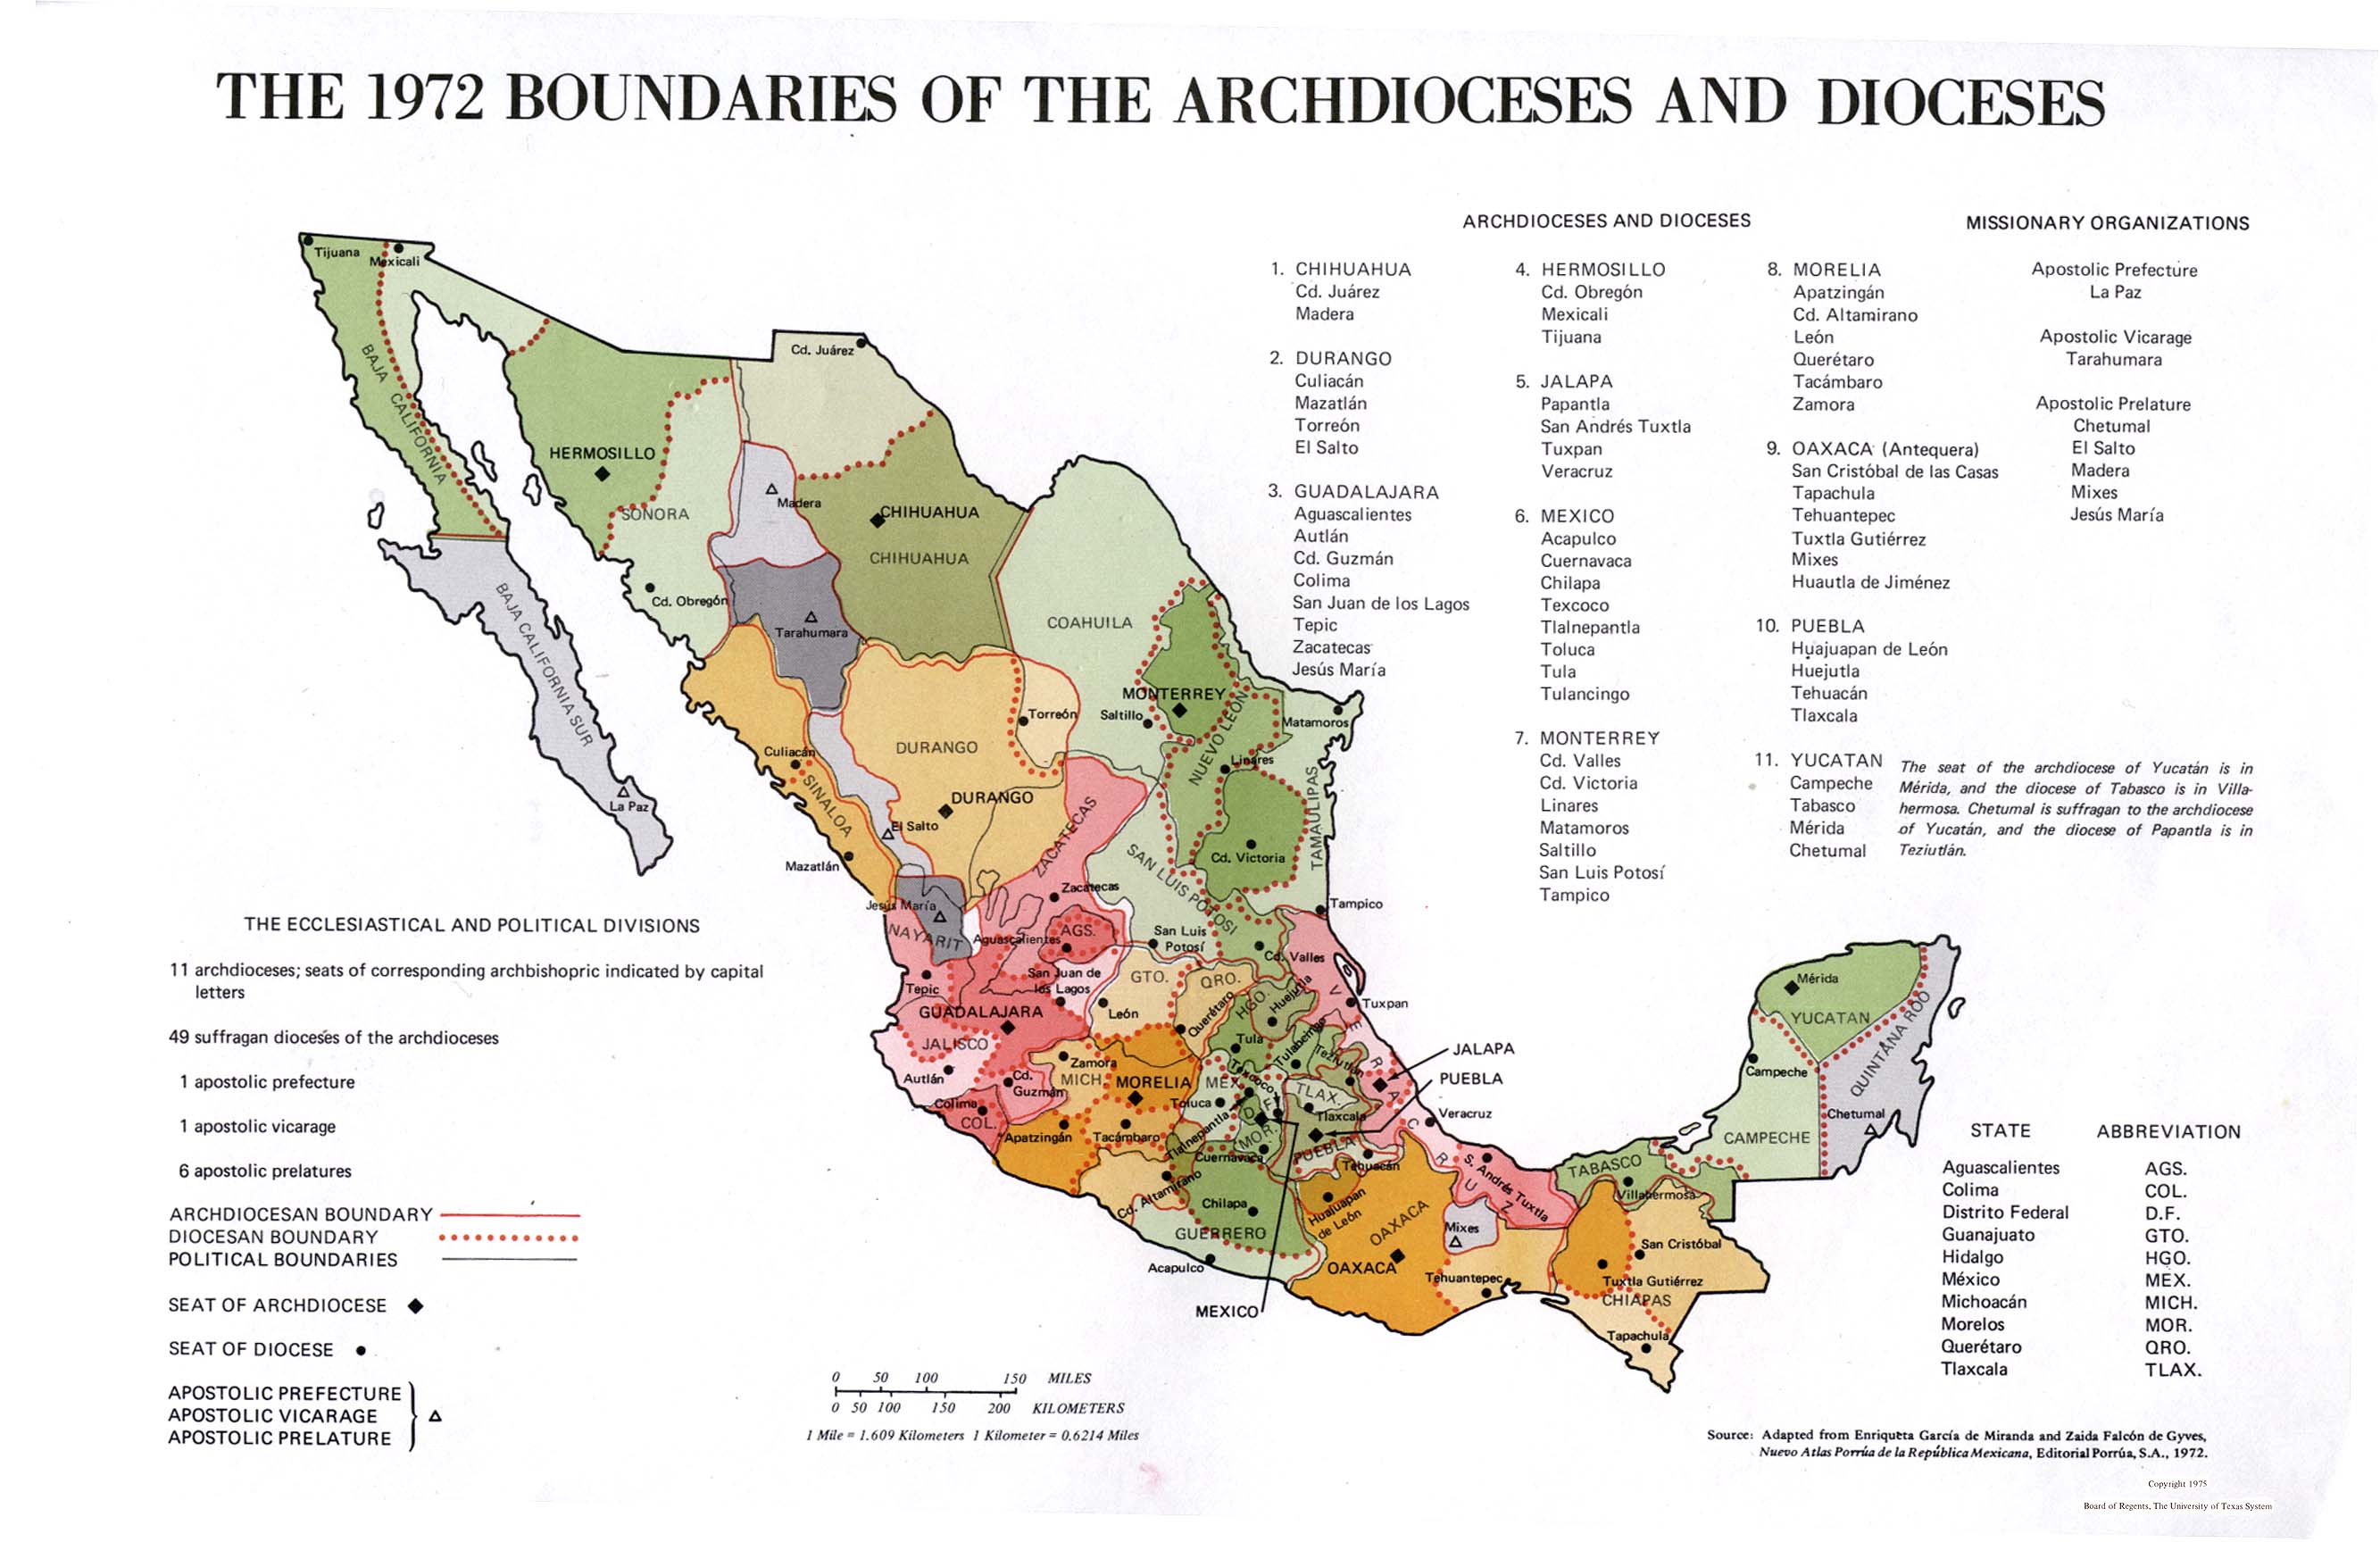
The 1972 Boundaries of Archdioceses and Dioceses (361K)
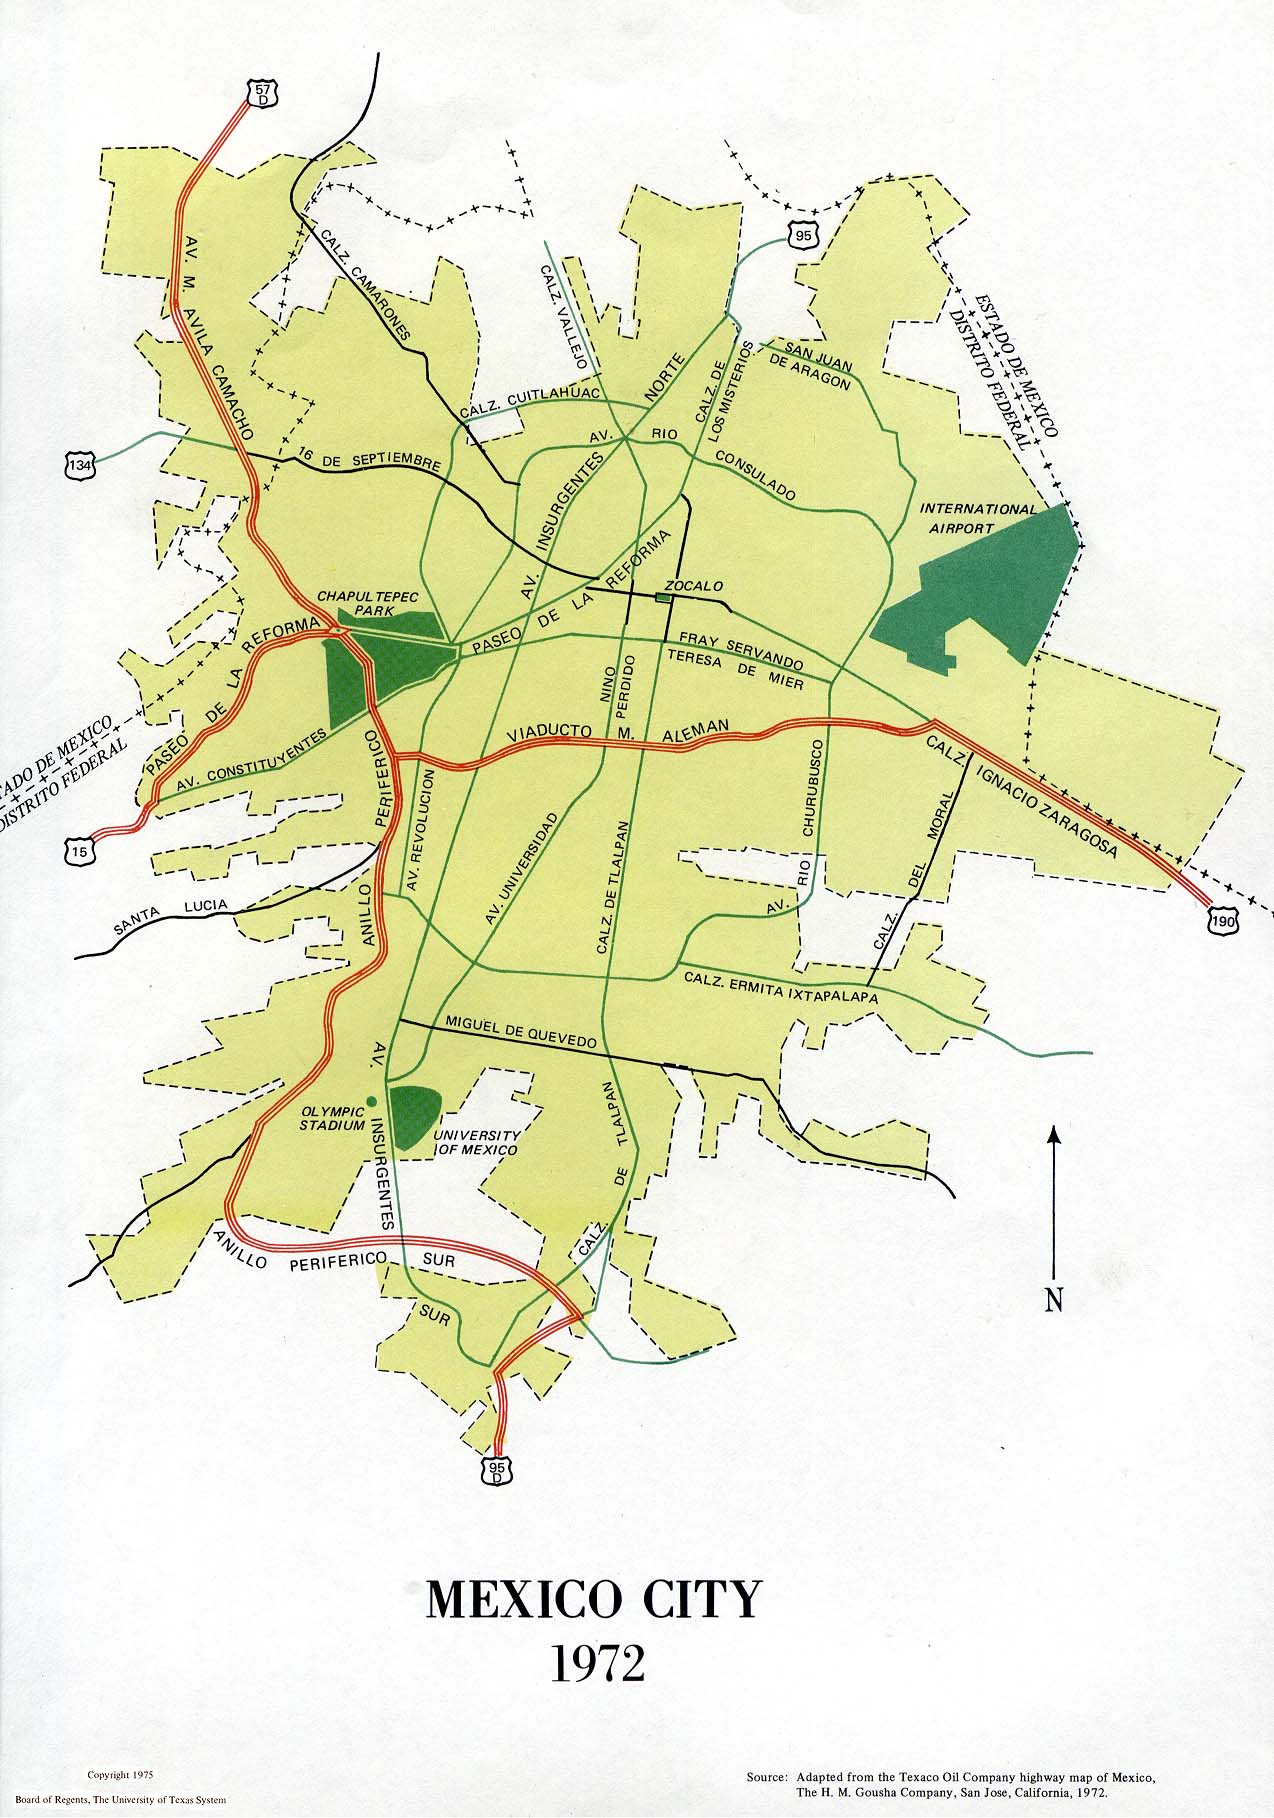
Mexico City, 1972 (252K)
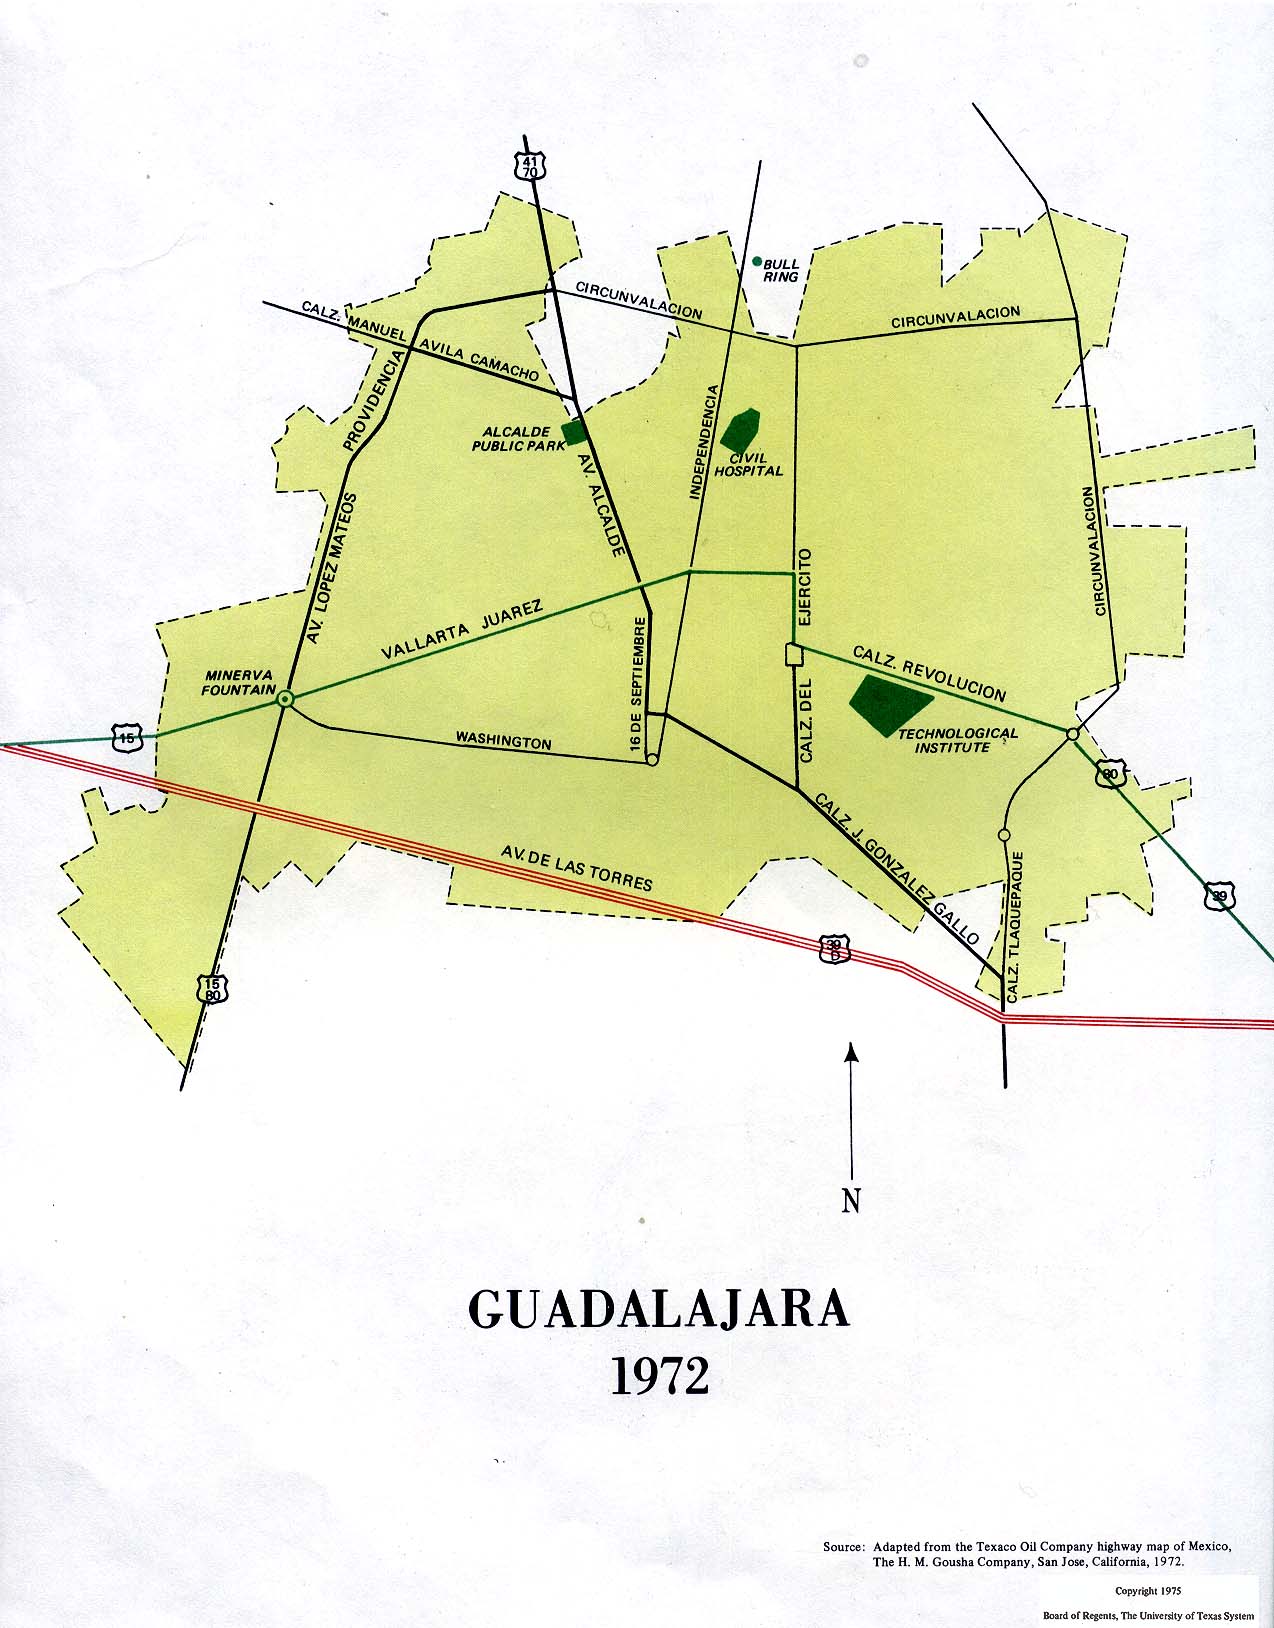
Guadalajara, 1972 (184K)
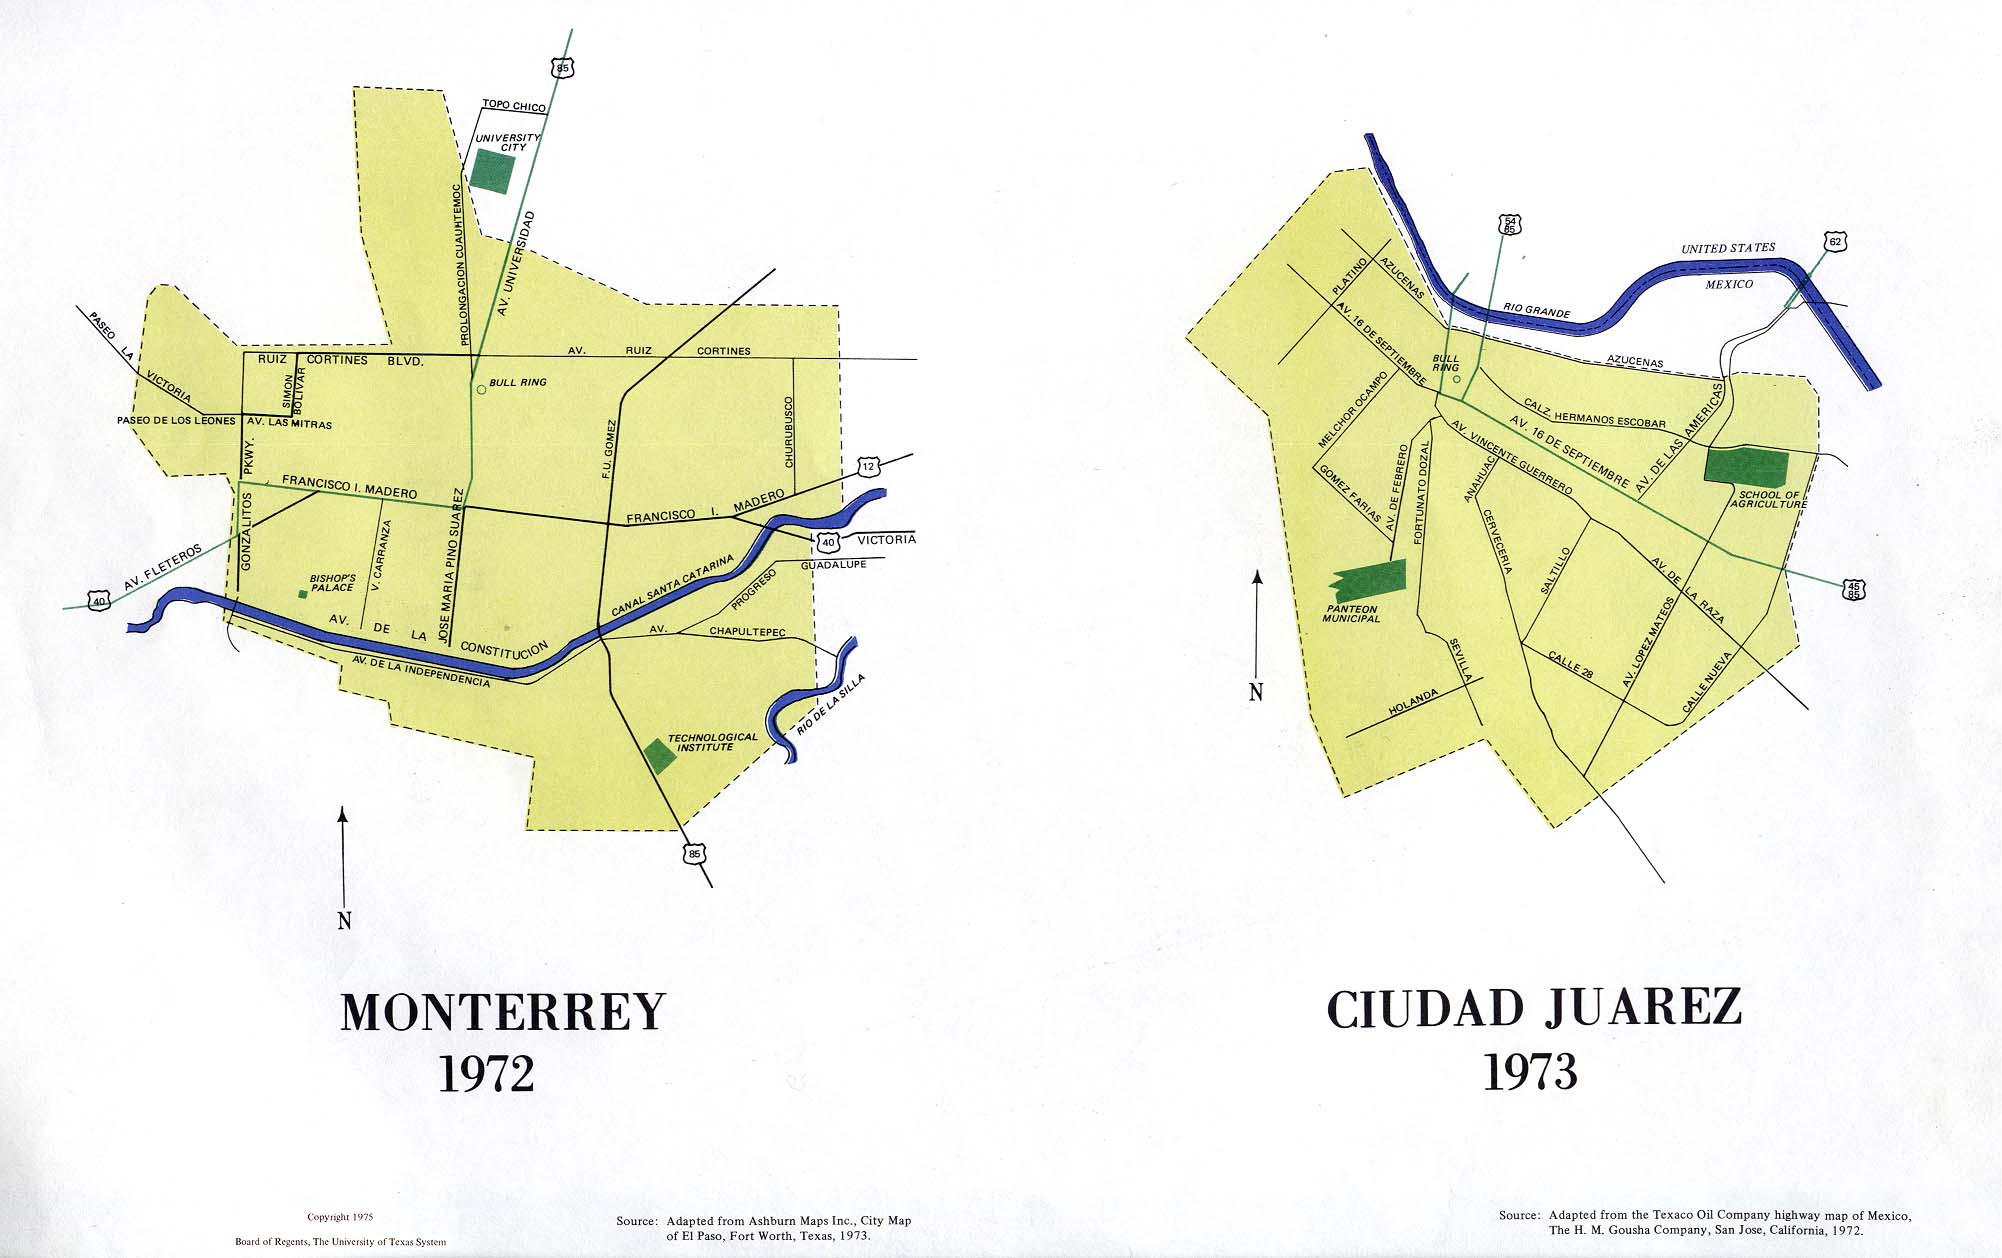
Monterrey, 1972 and Ciudad Juarez, 1973 (195K)
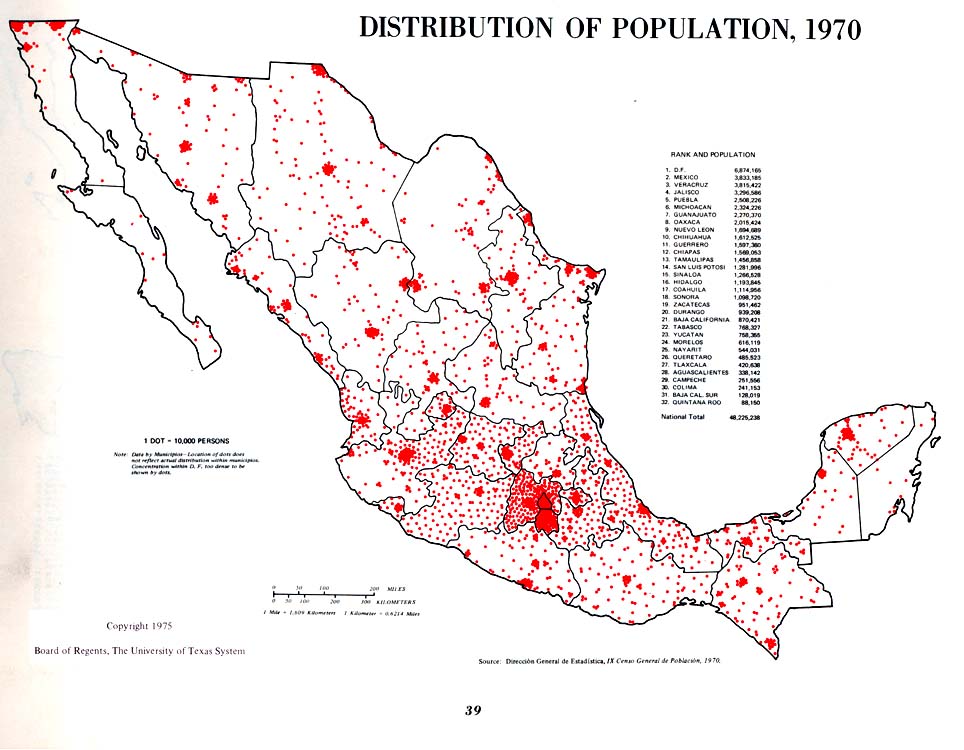
Distribution of Population, 1970 (142K)
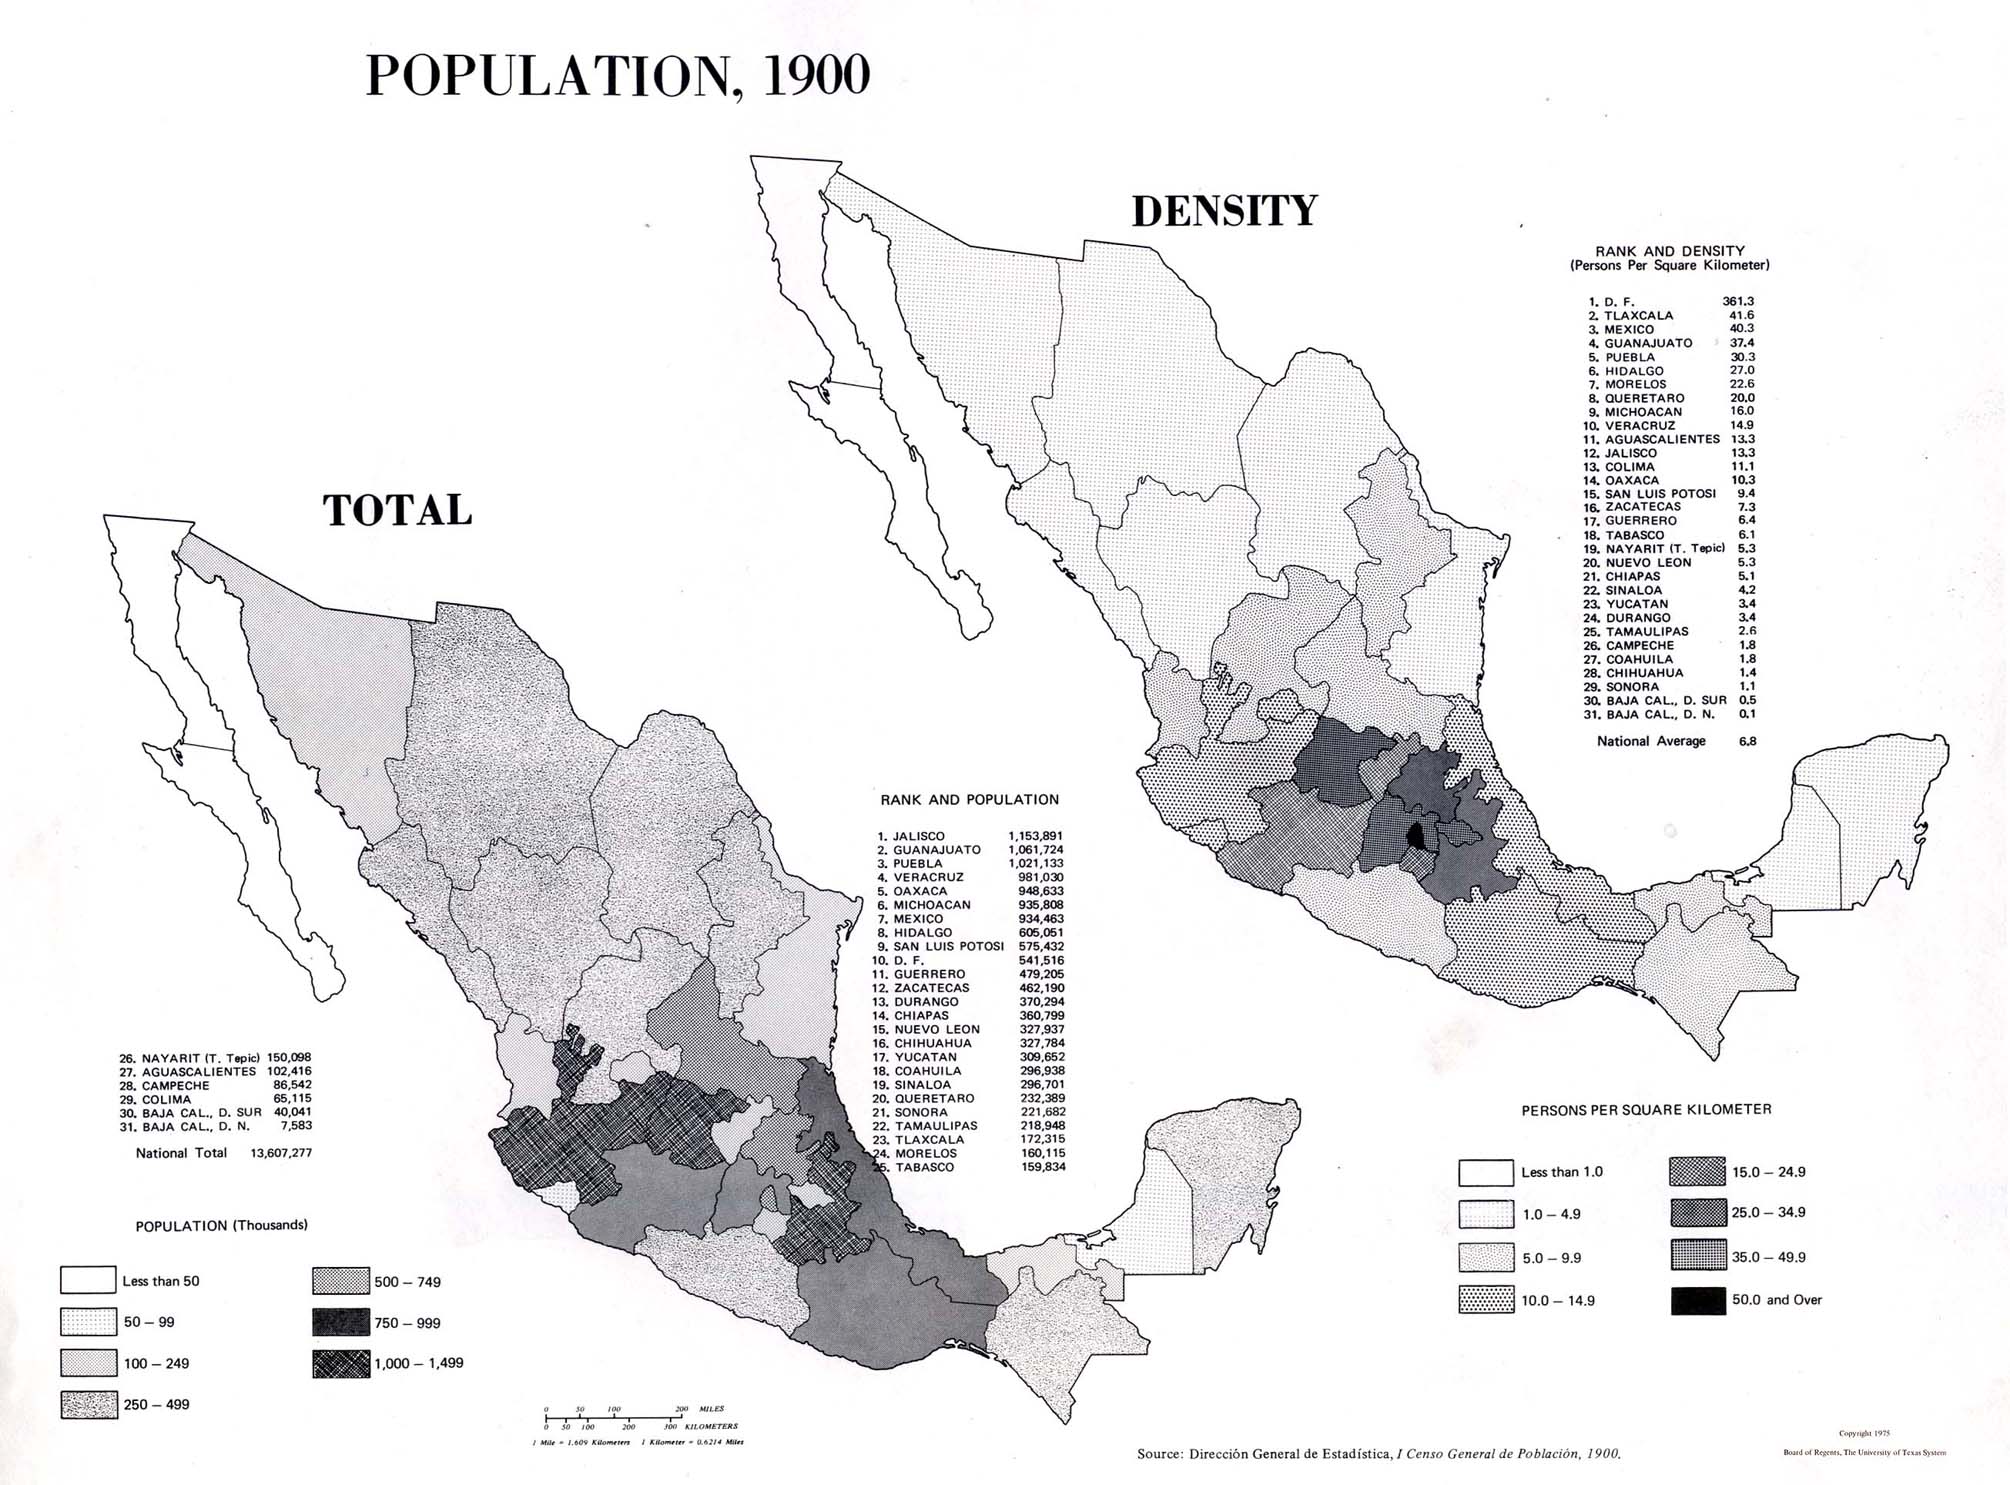
Population, 1900: Total; Density (362K)
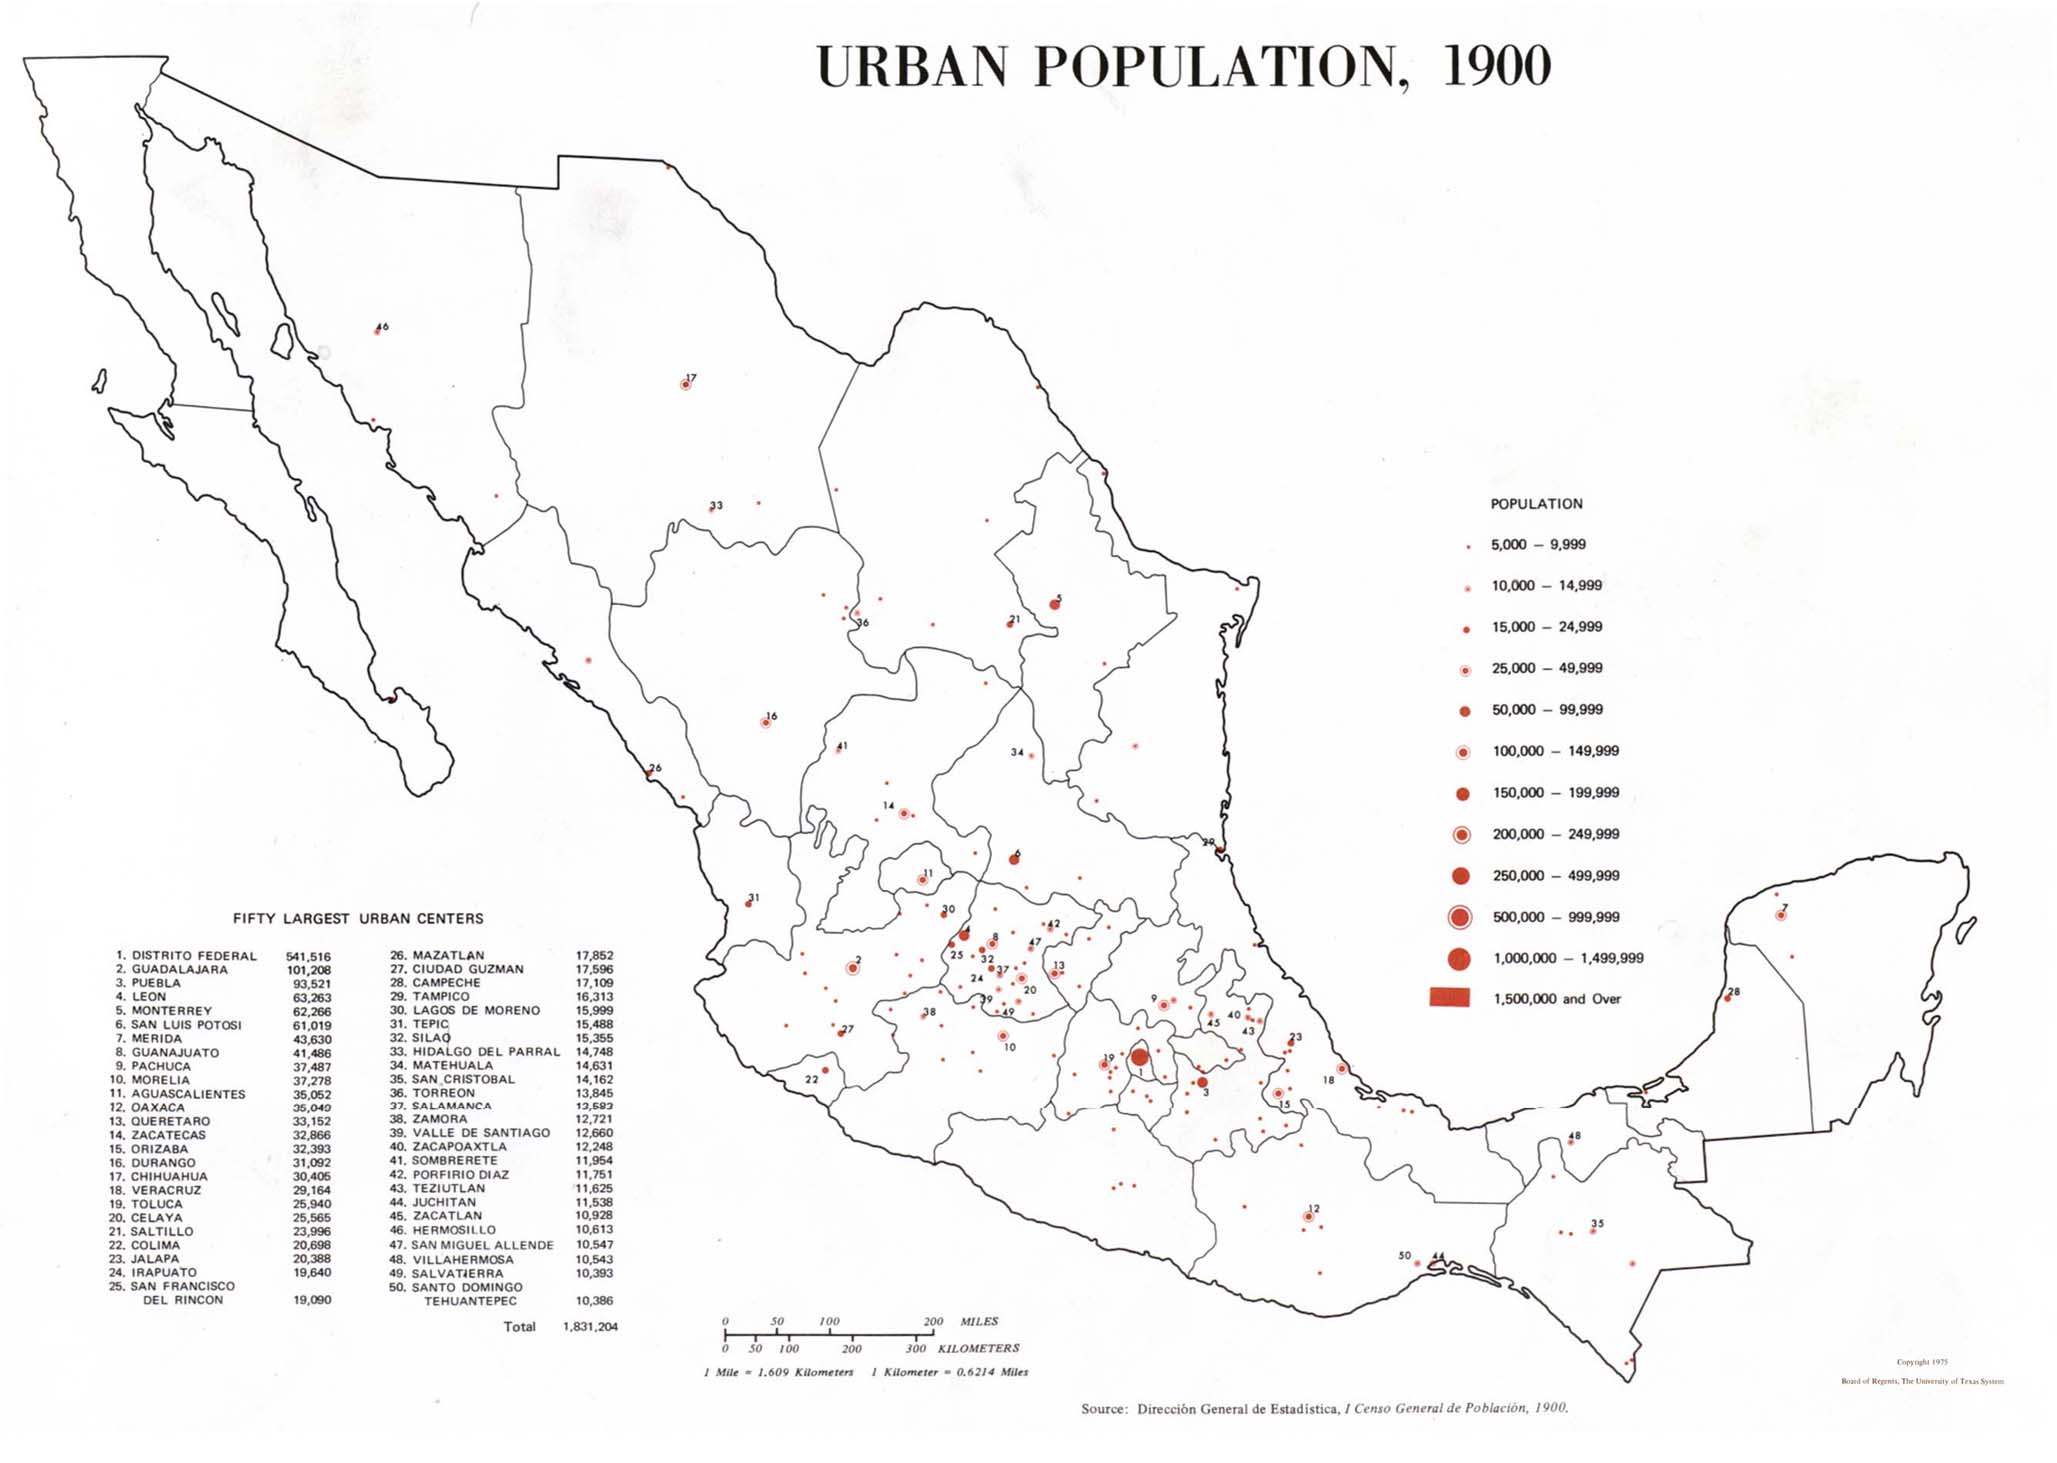
Urban Population, 1900 (174K)
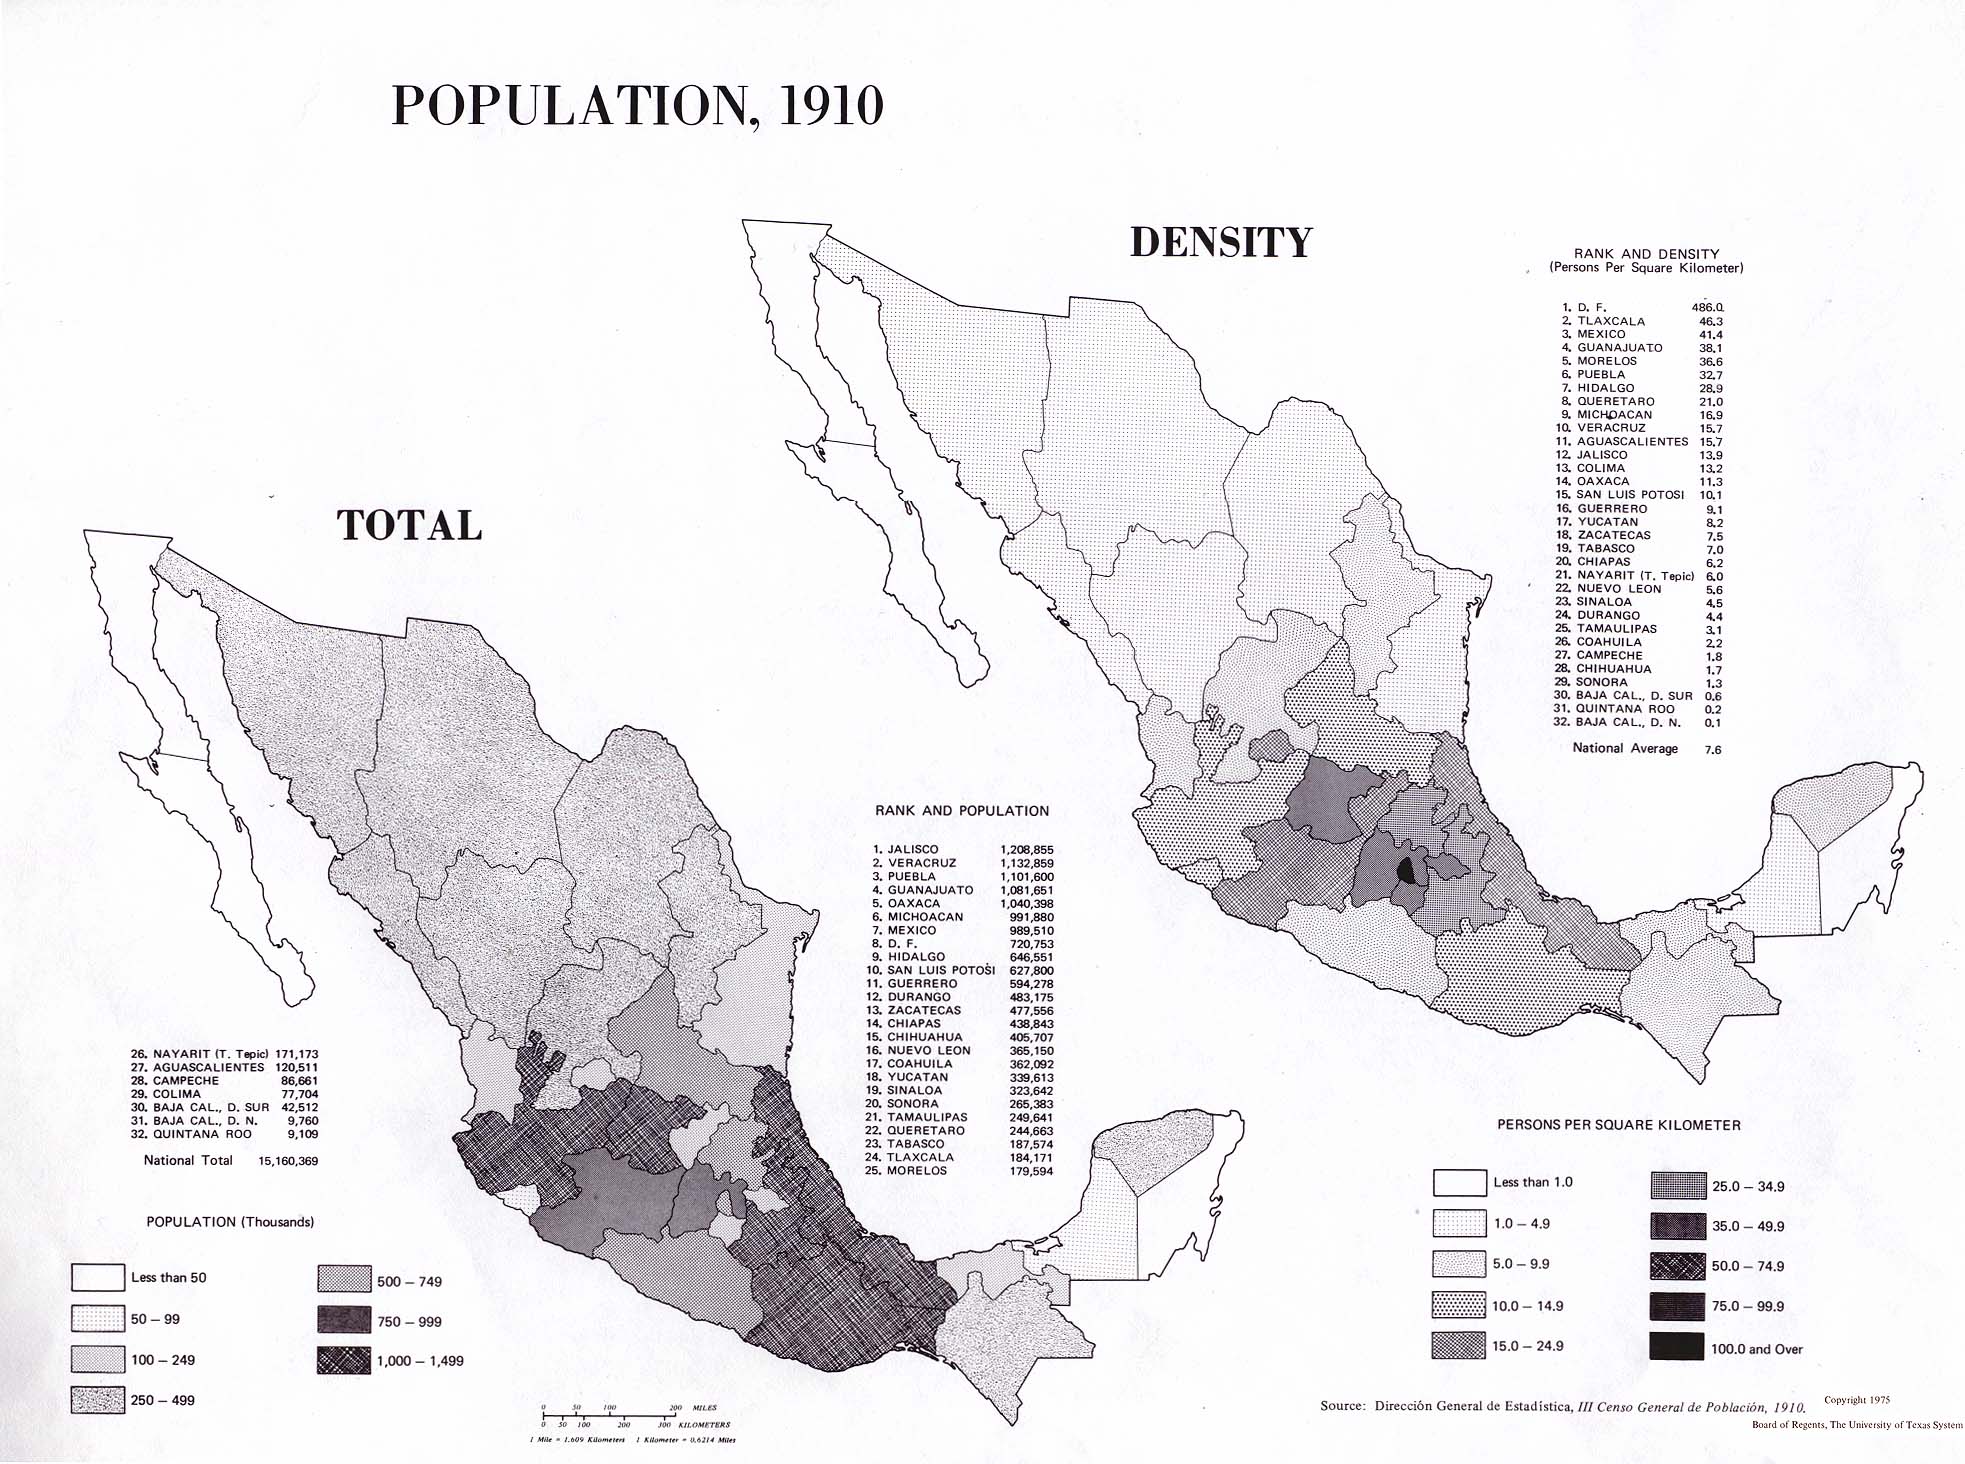
Population, 1910: Total; Density (362K)
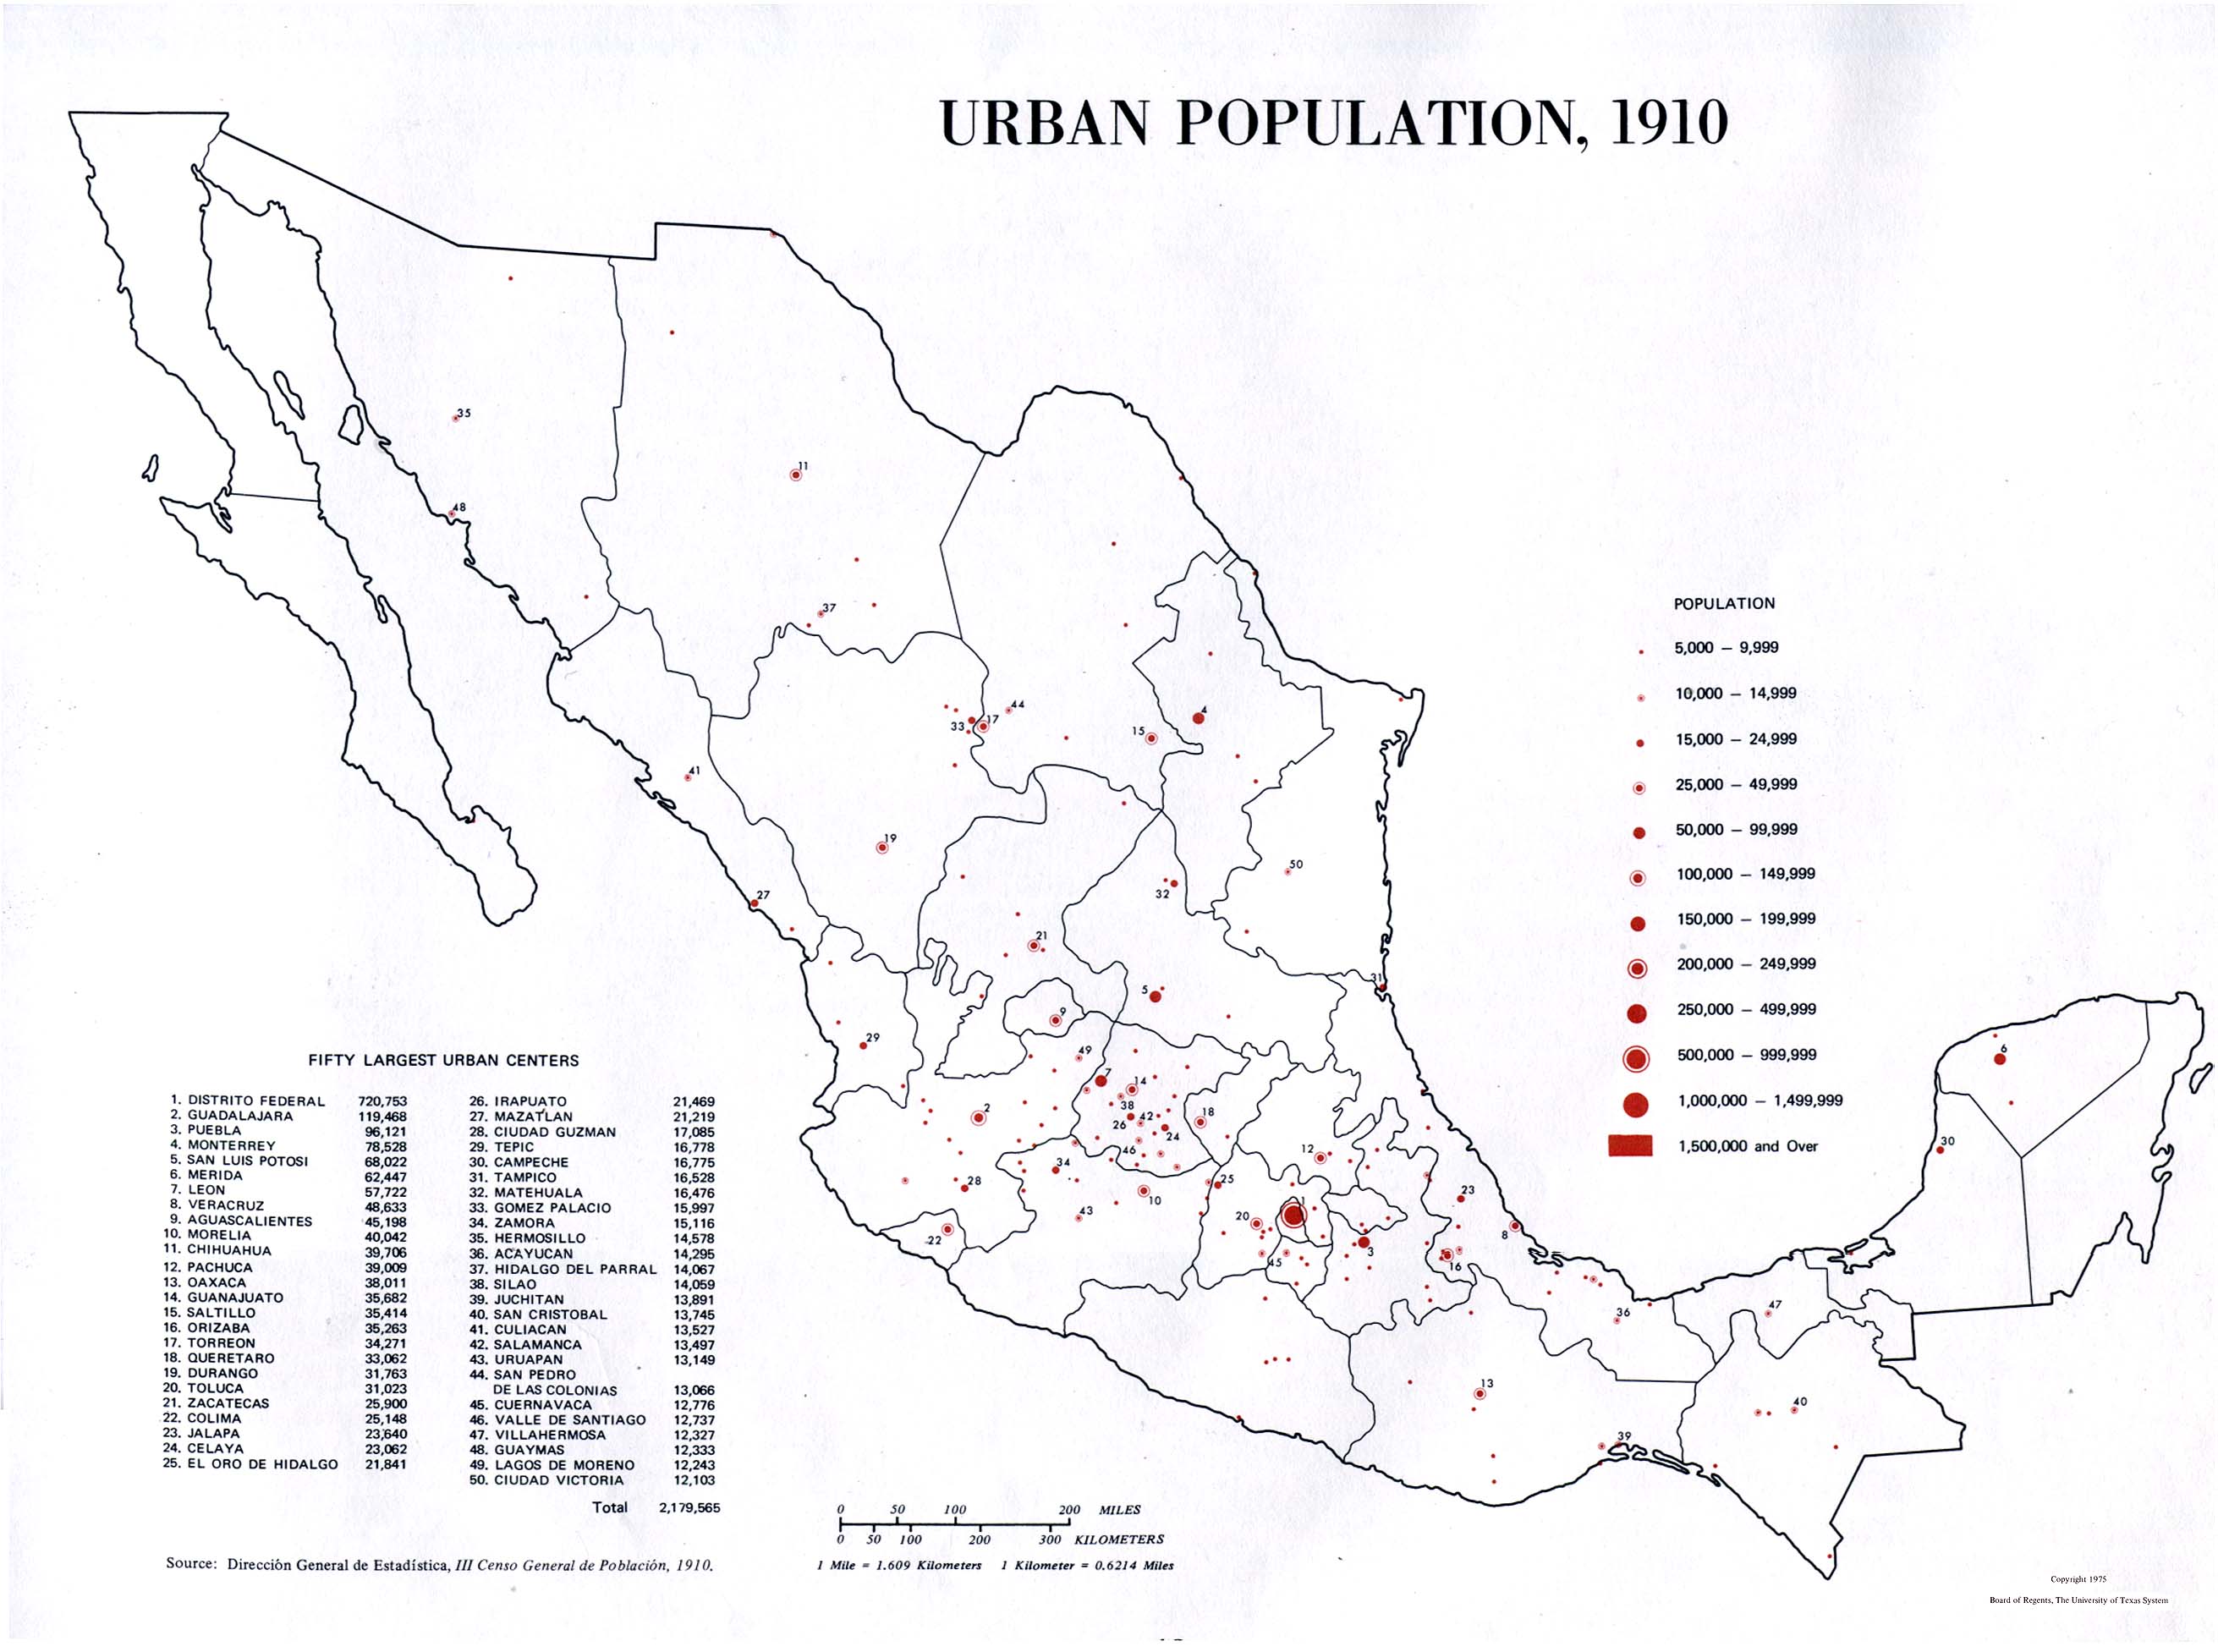
Urban Population, 1910 (343K)
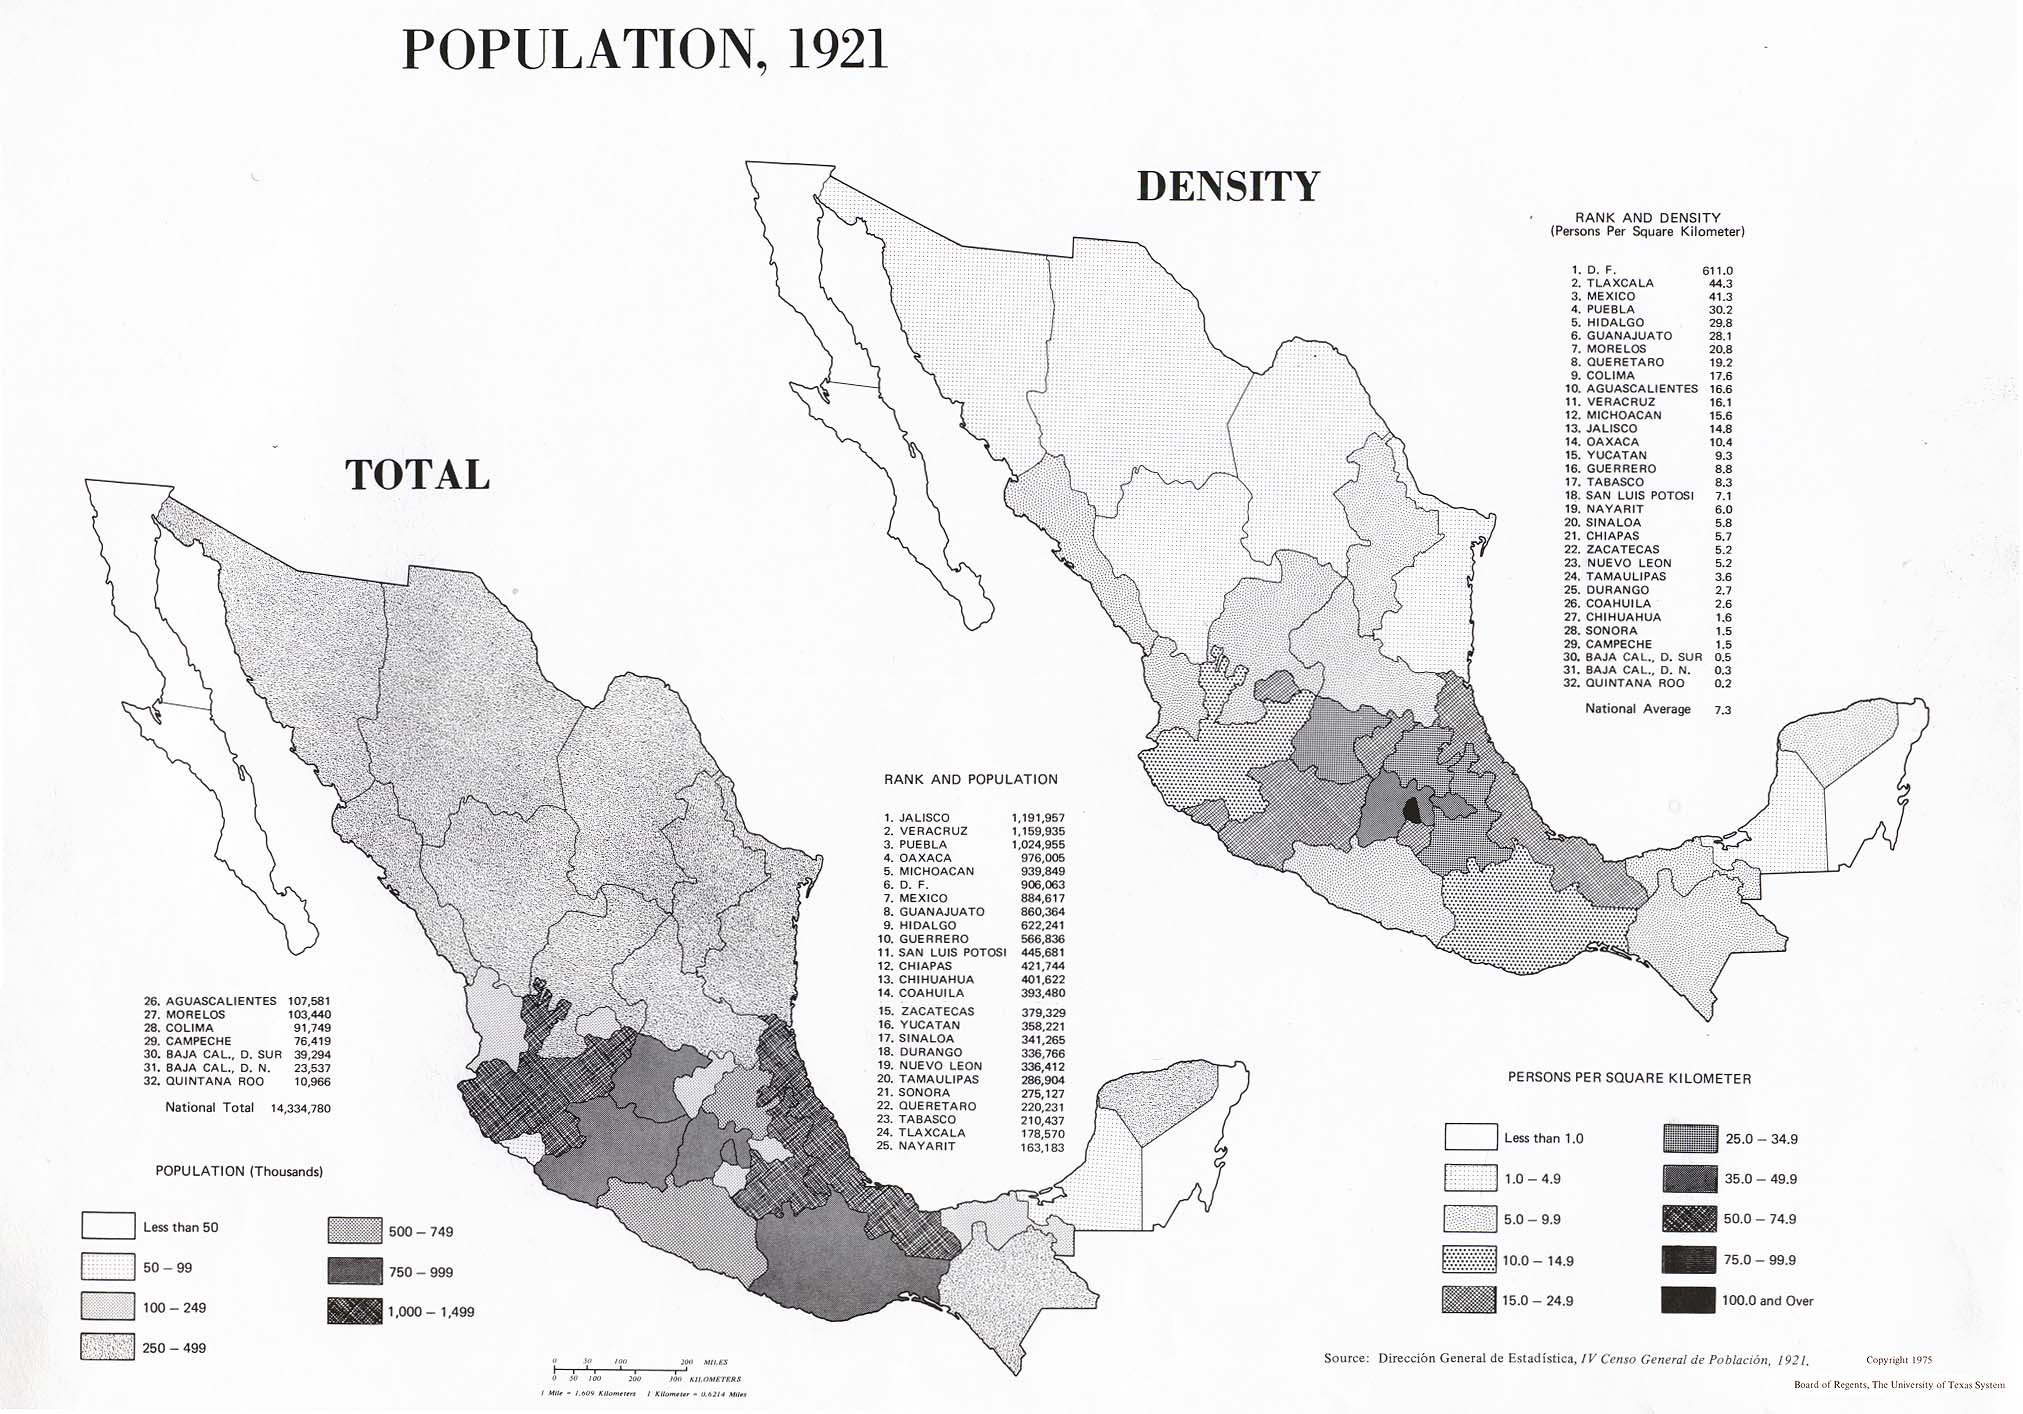
Population, 1921: Total; Density (362K)
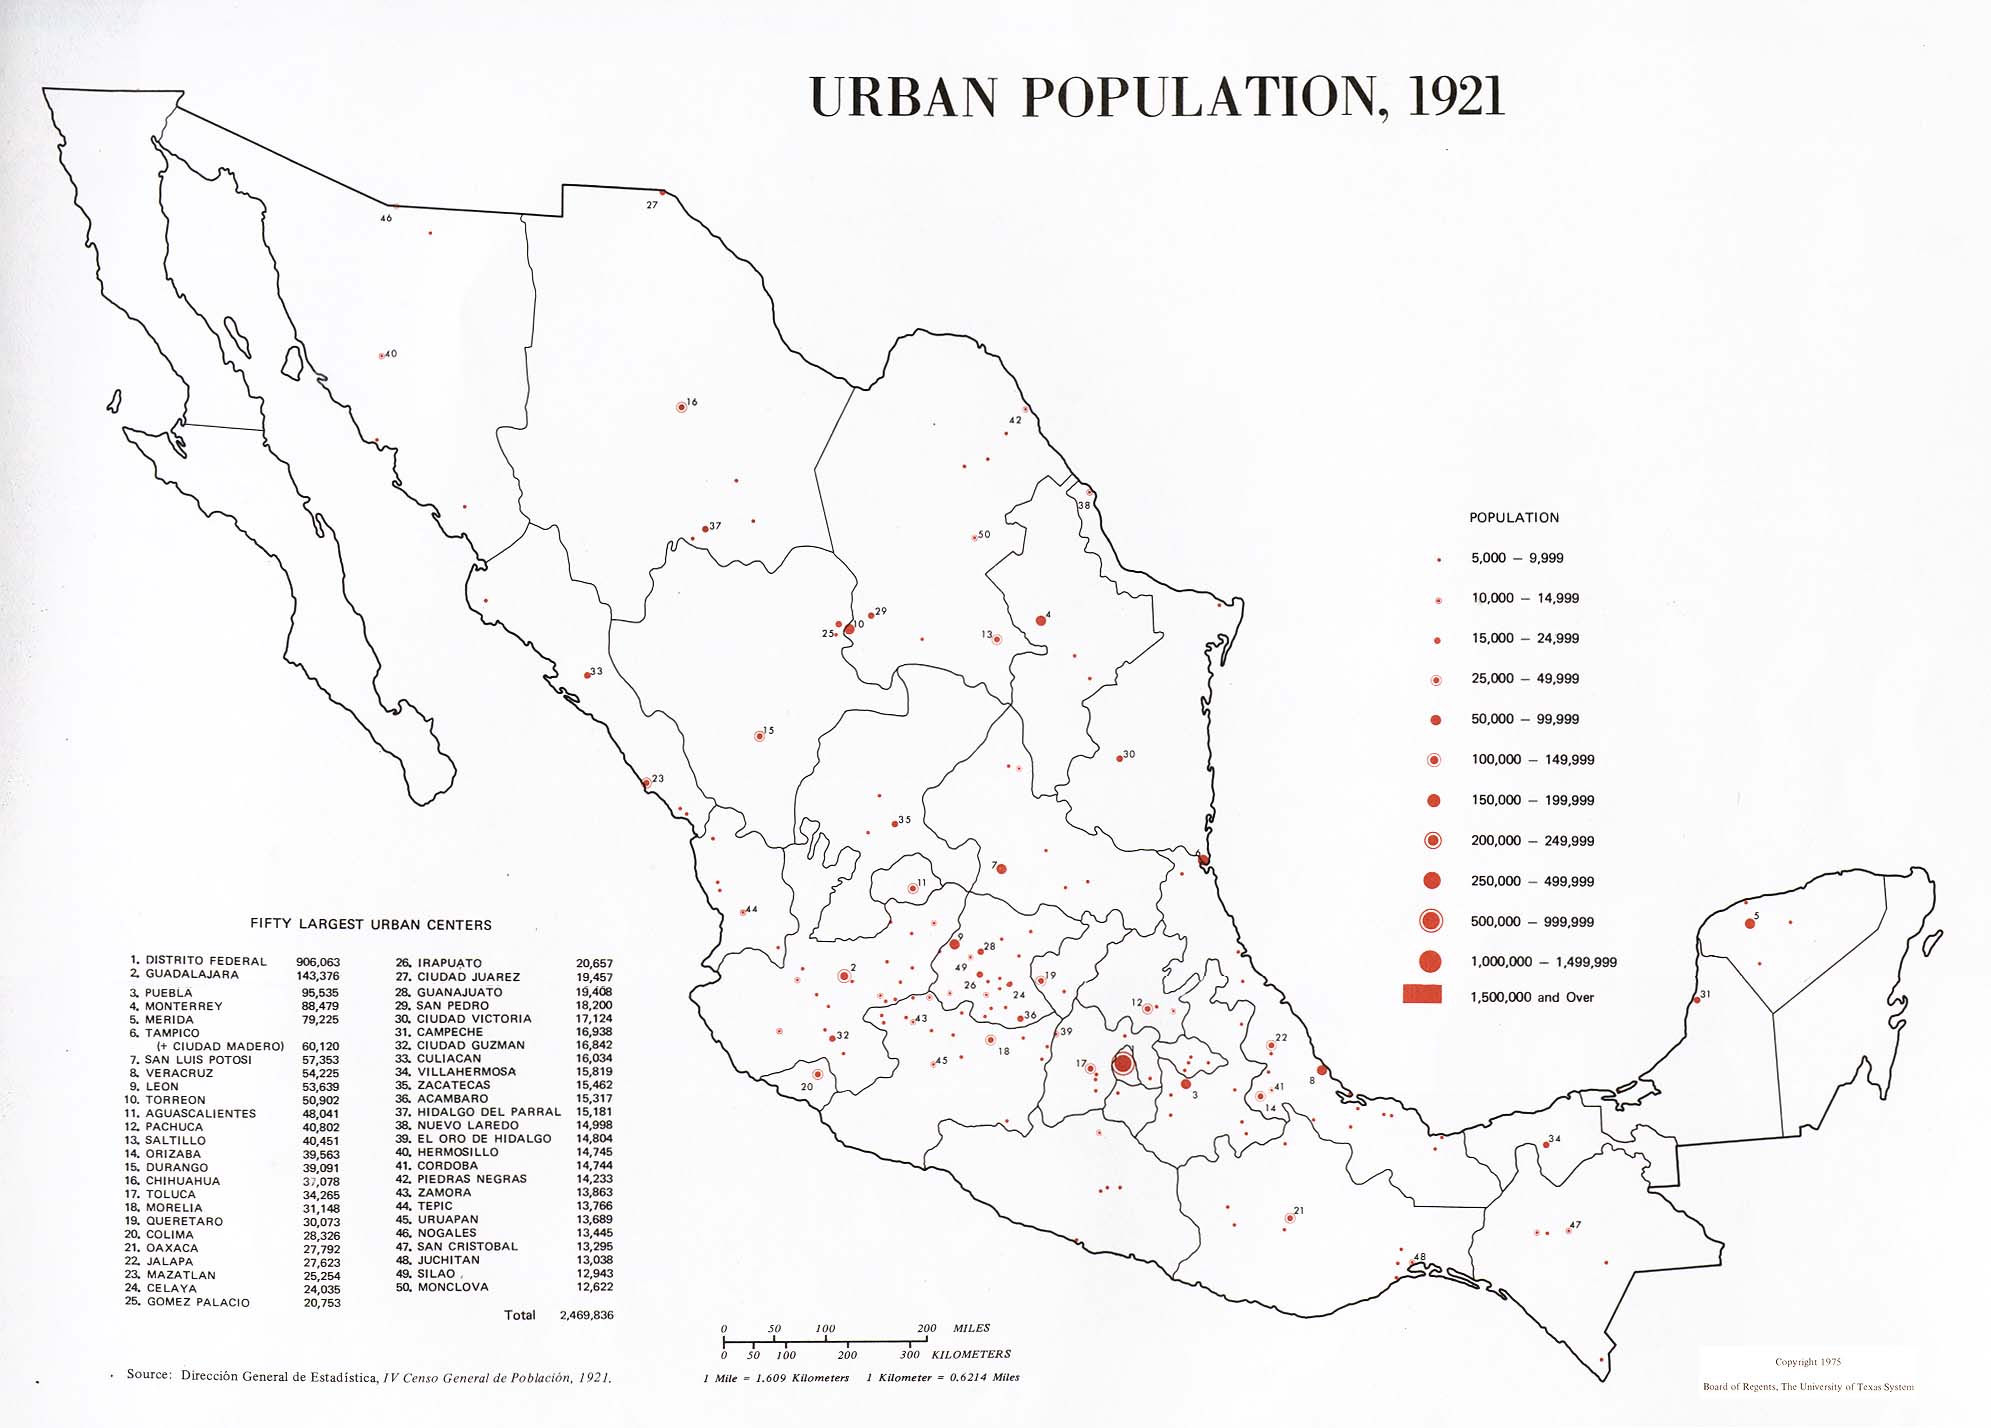
Urban Population, 1921 (213K)
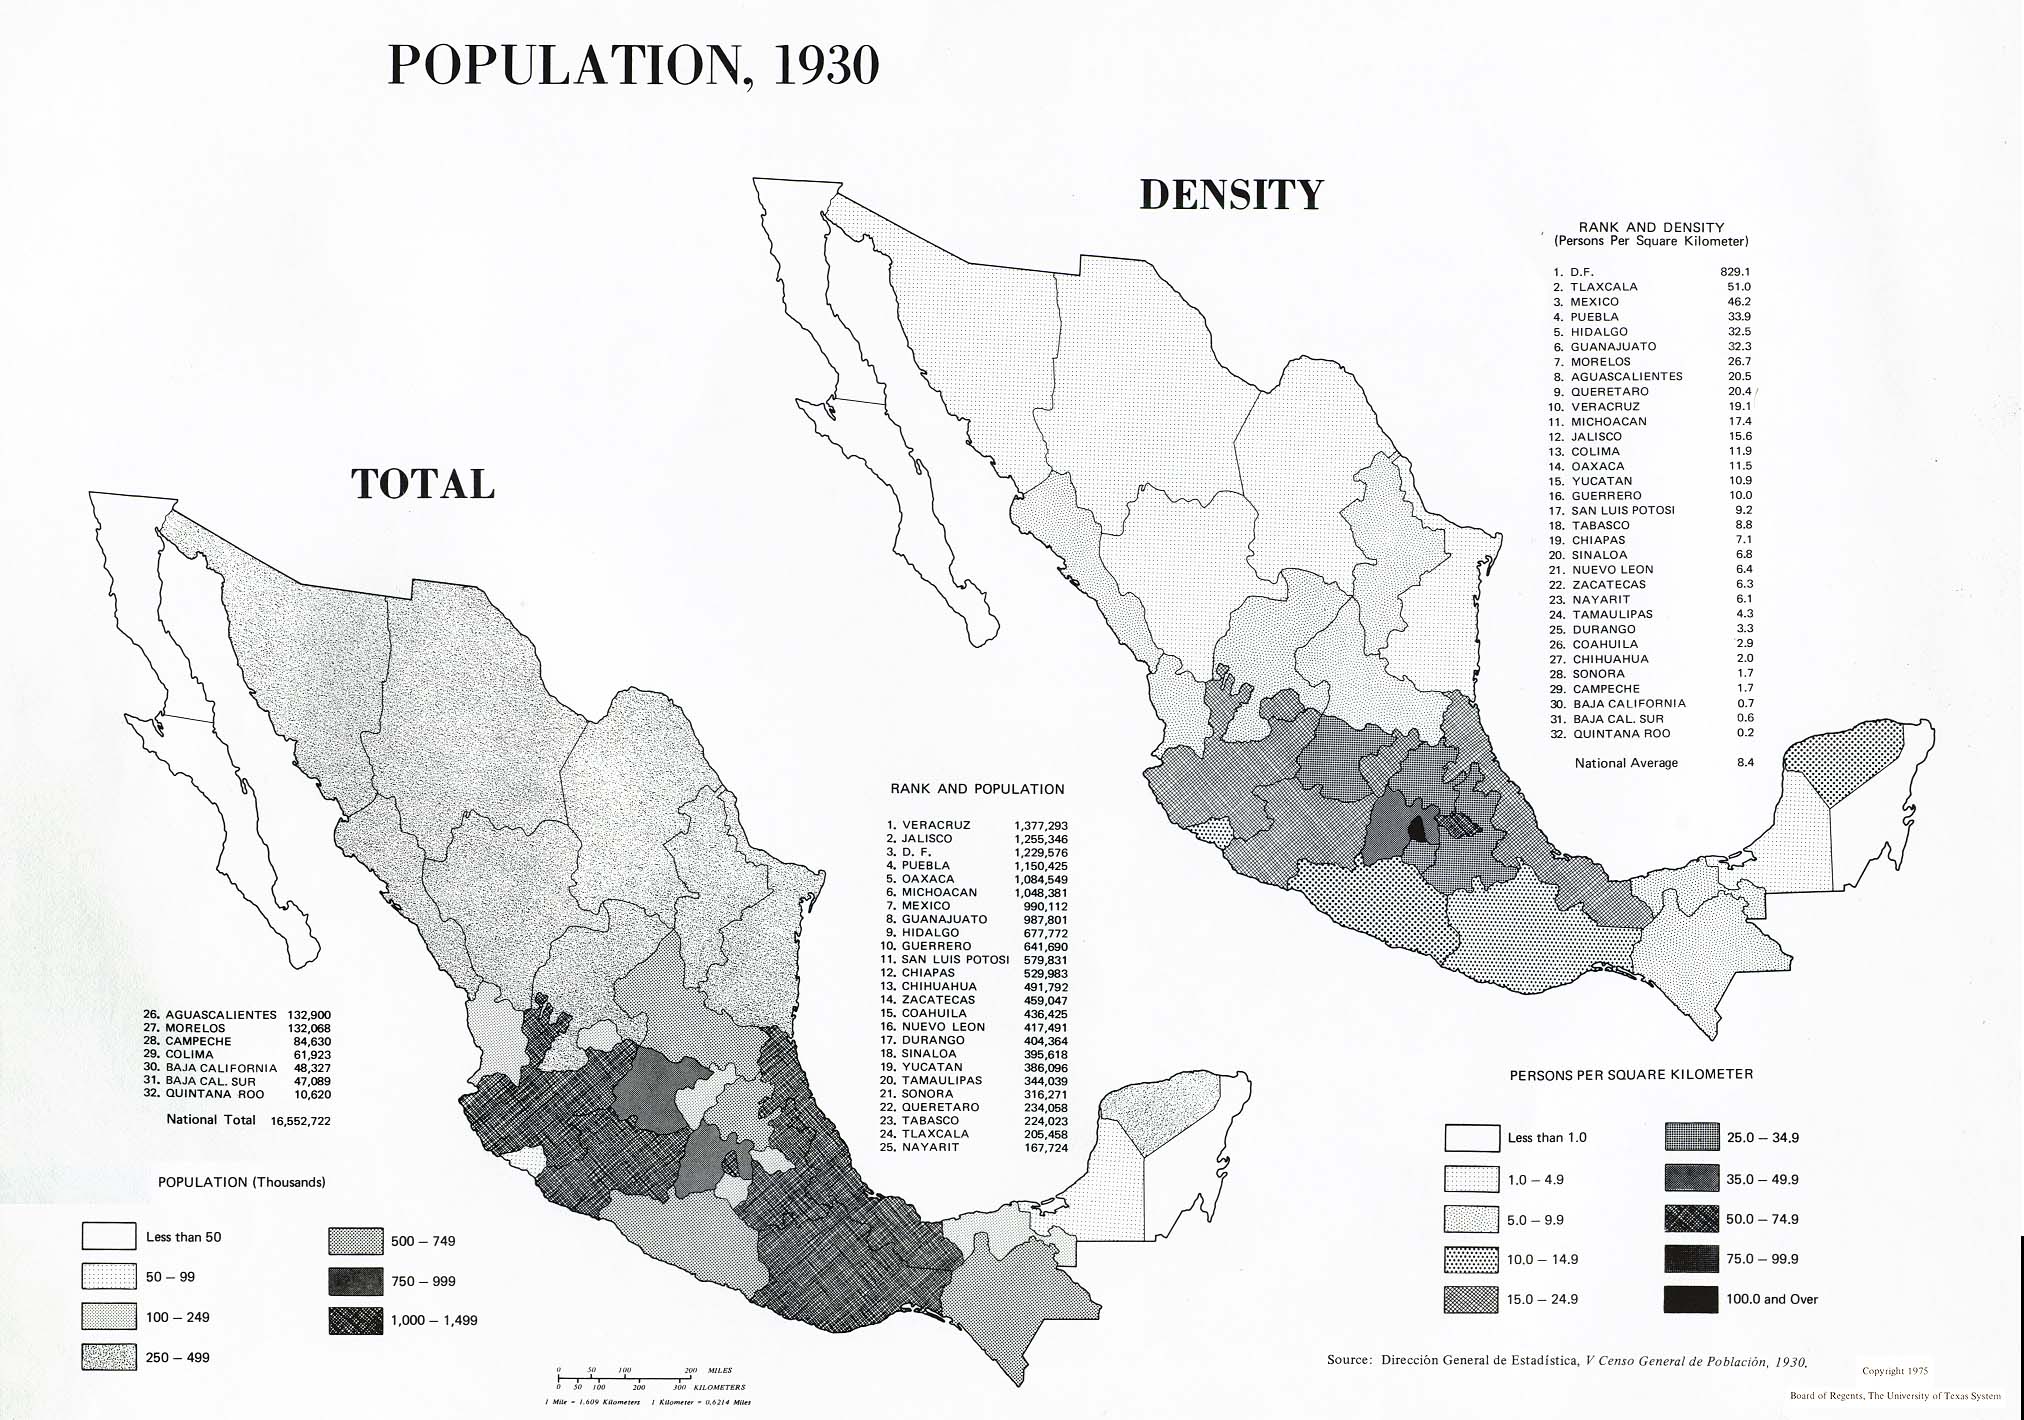
Population, 1930: Total; Density (454K)
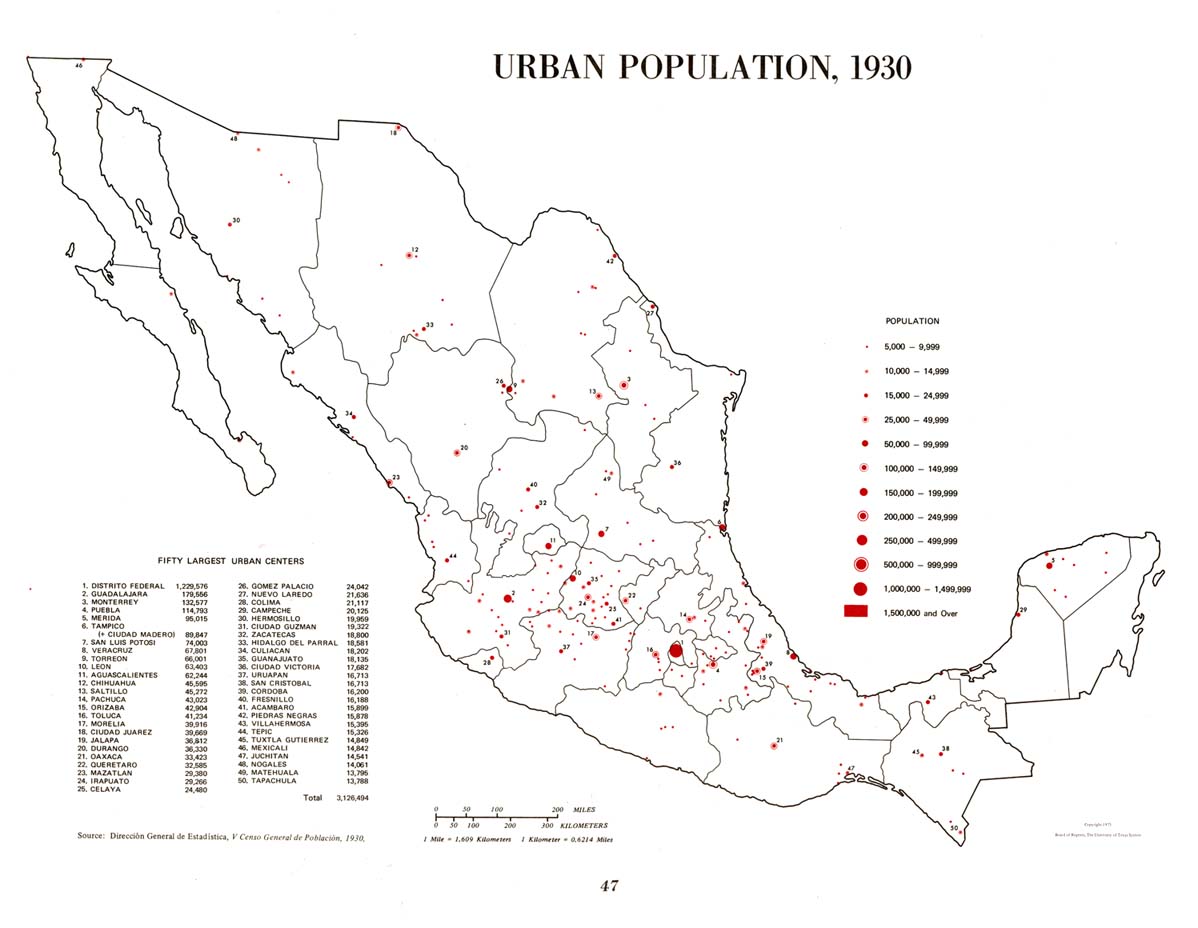
Urban Population, 1930 (123K)
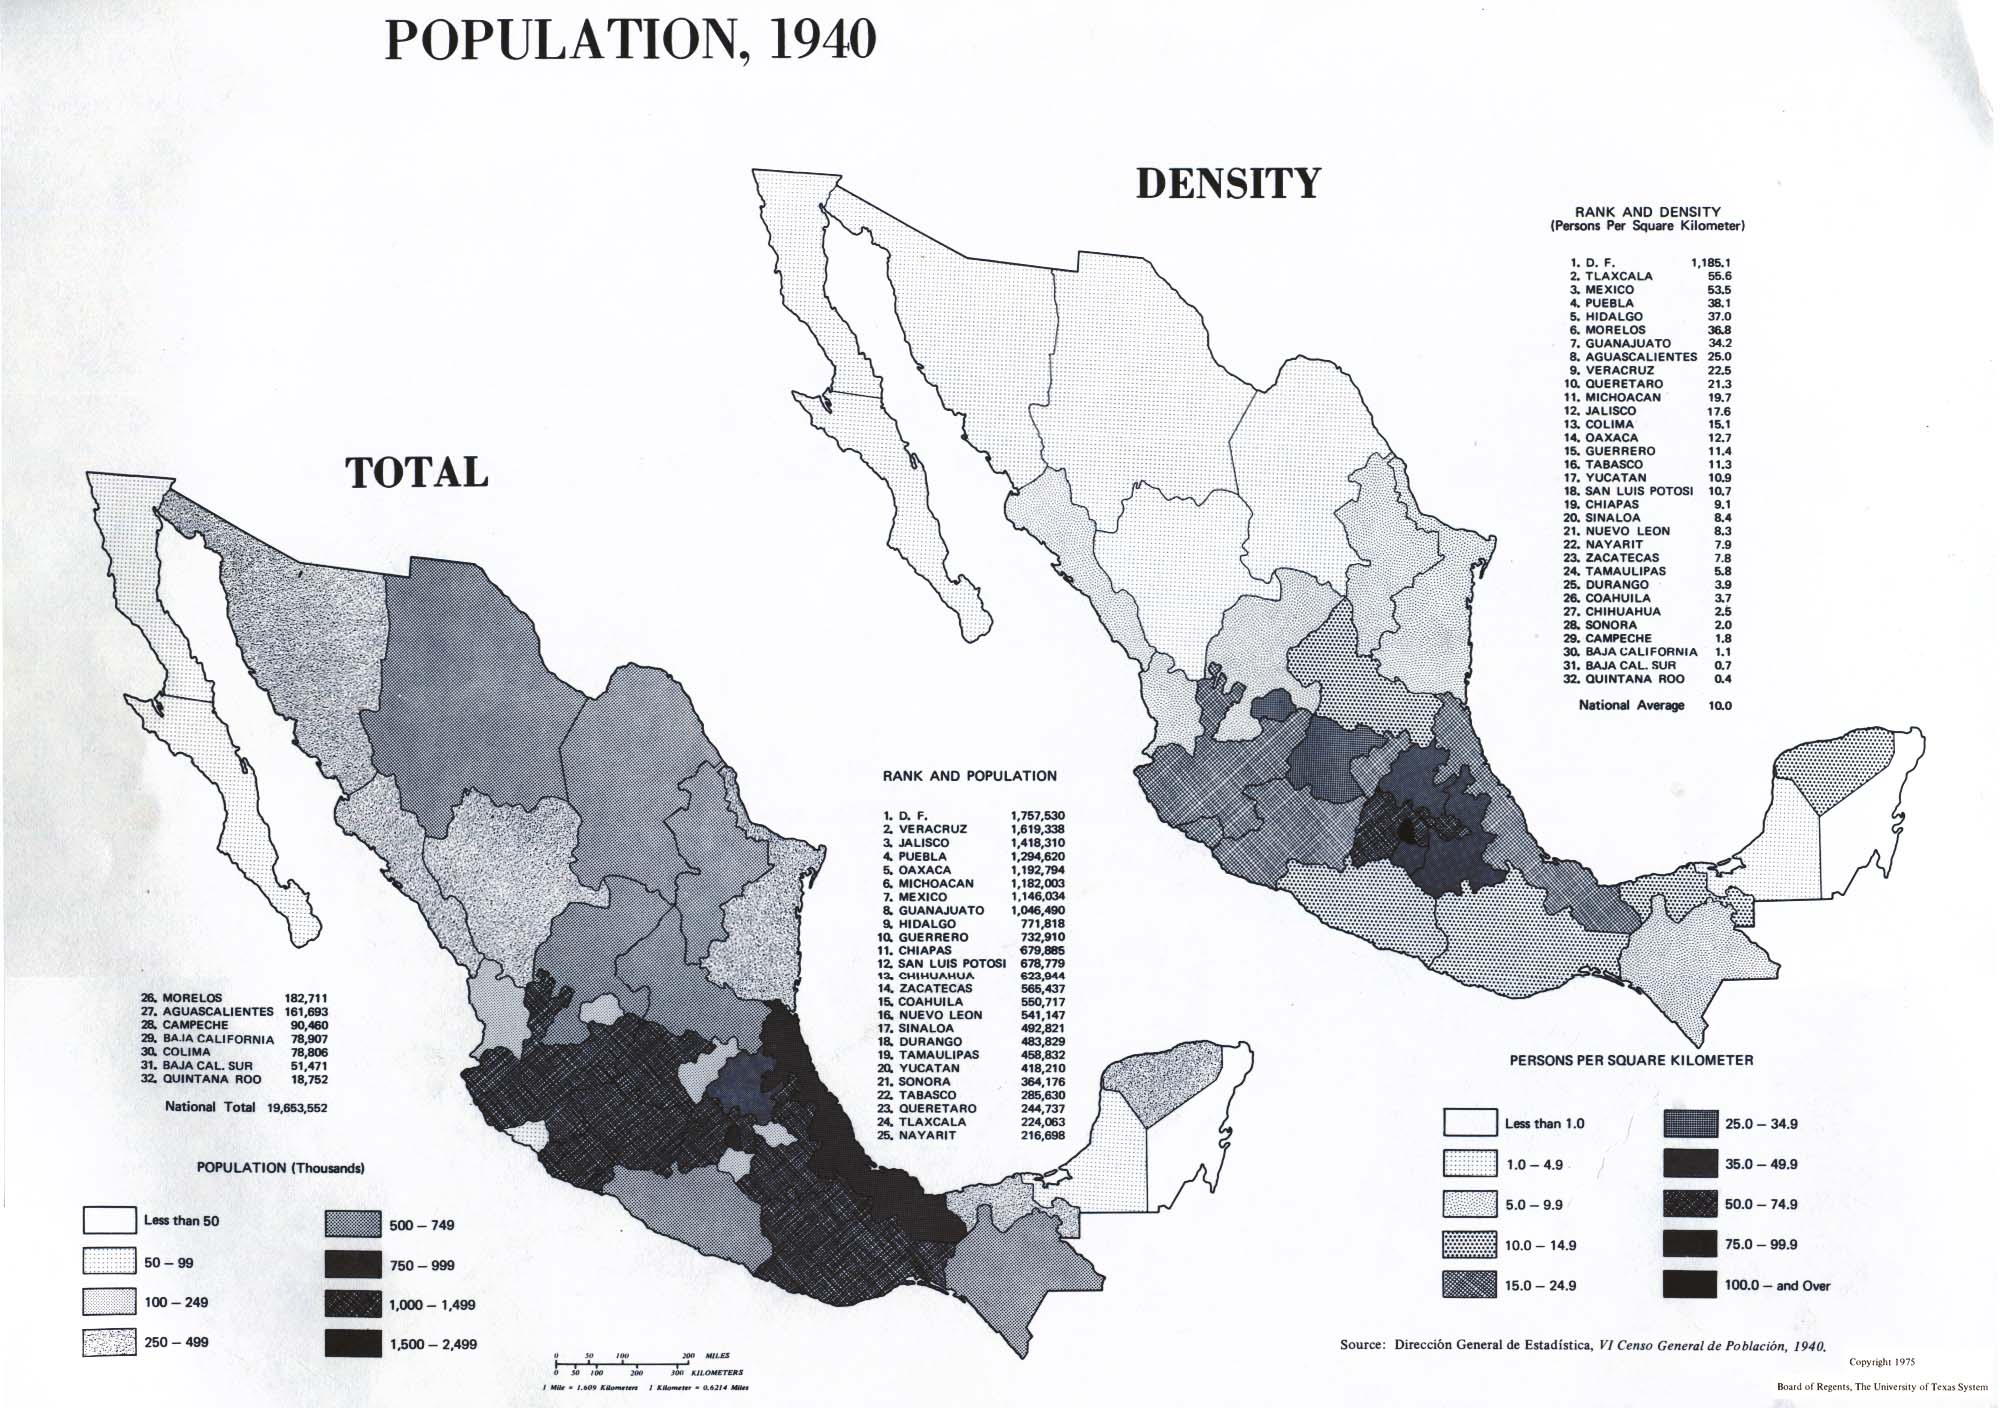
Population, 1940: Total; Density (372K)
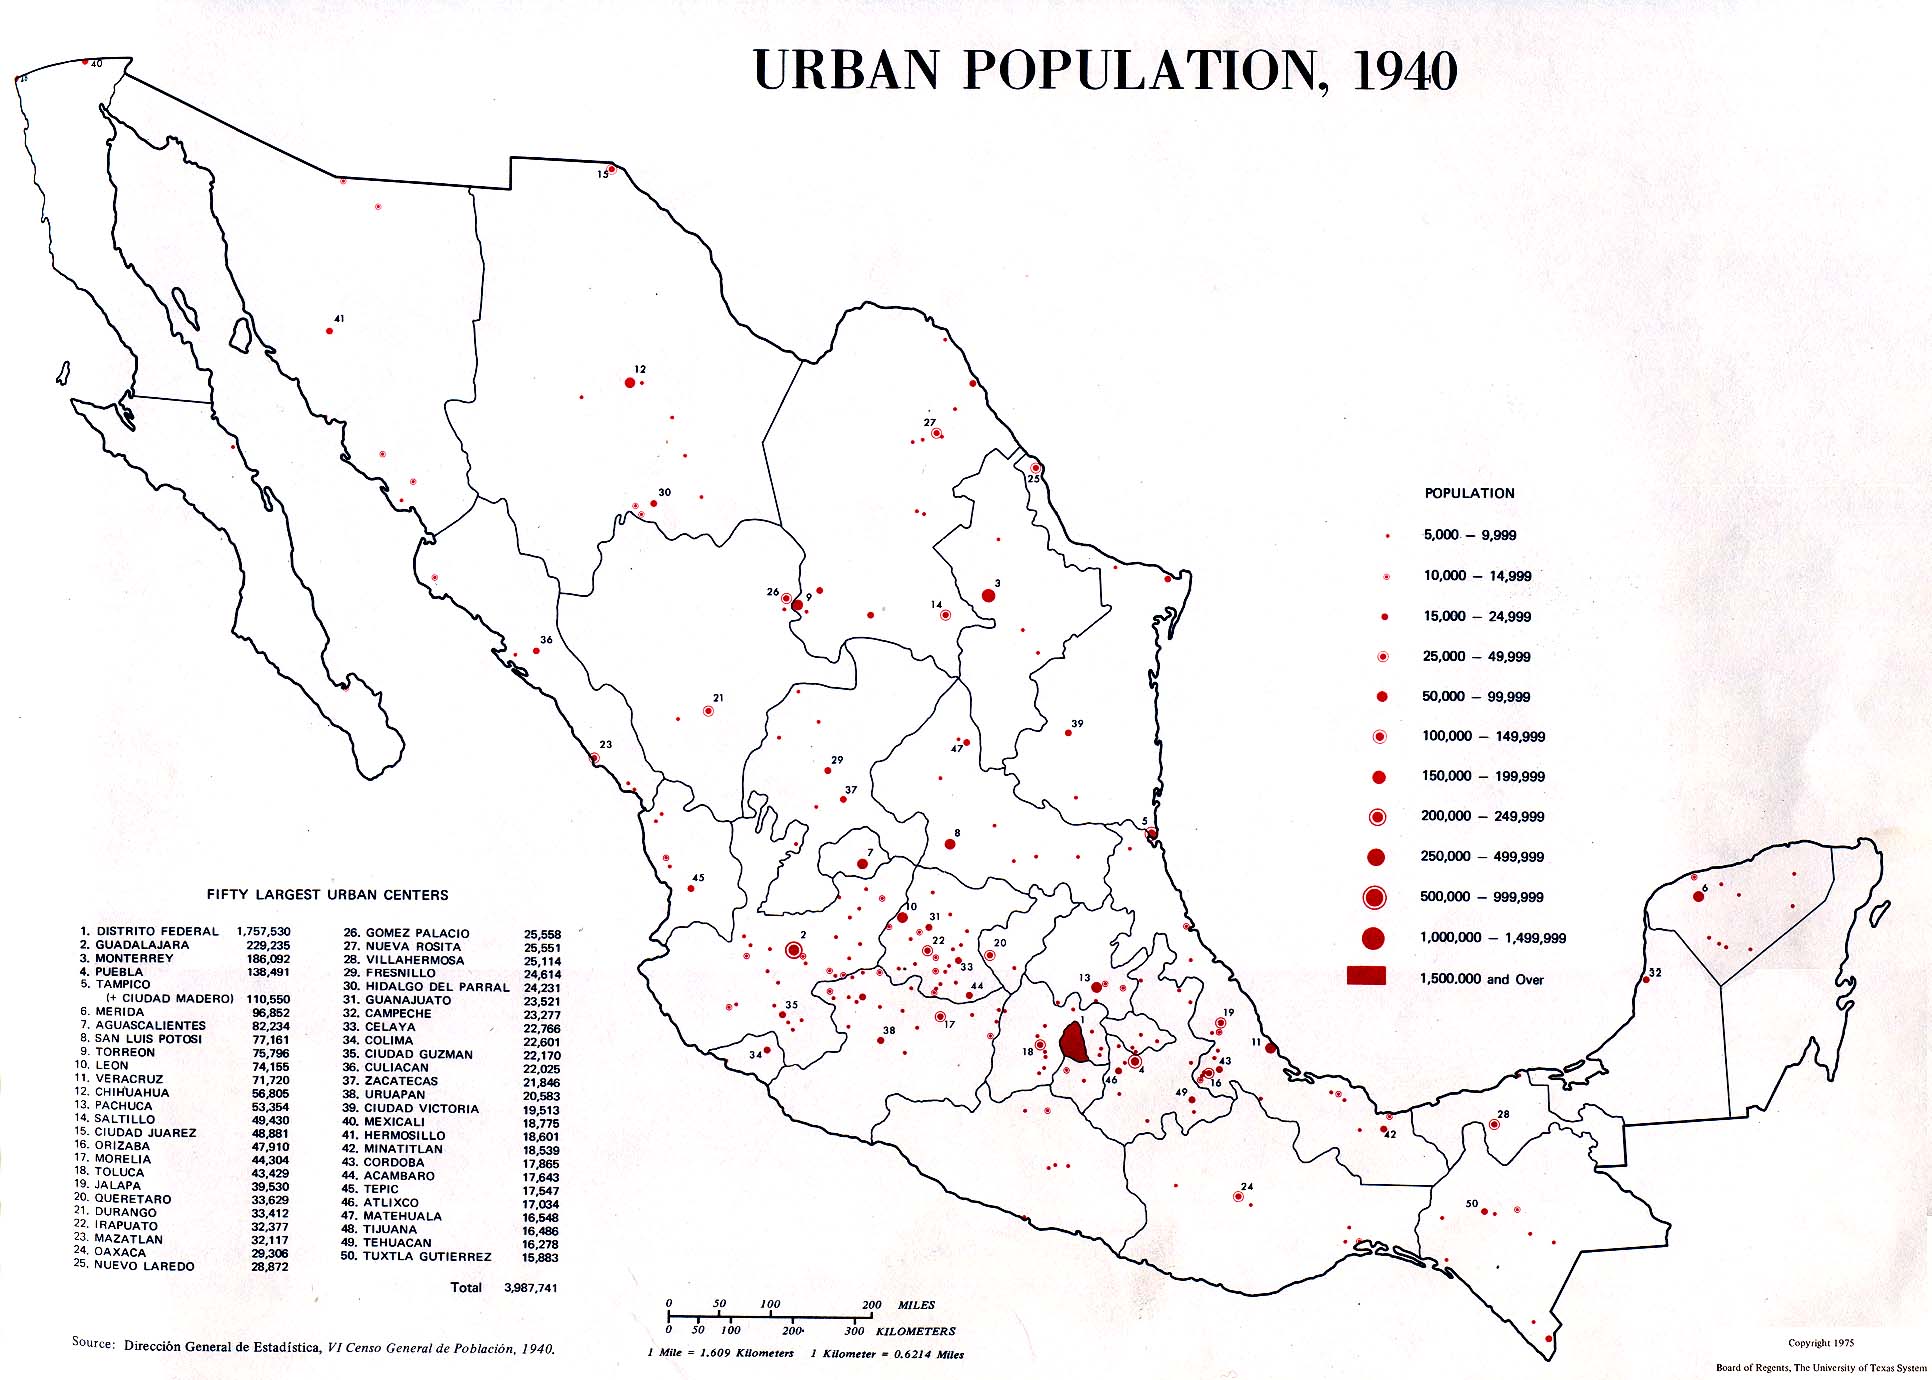
Urban Population, 1940 (287K)
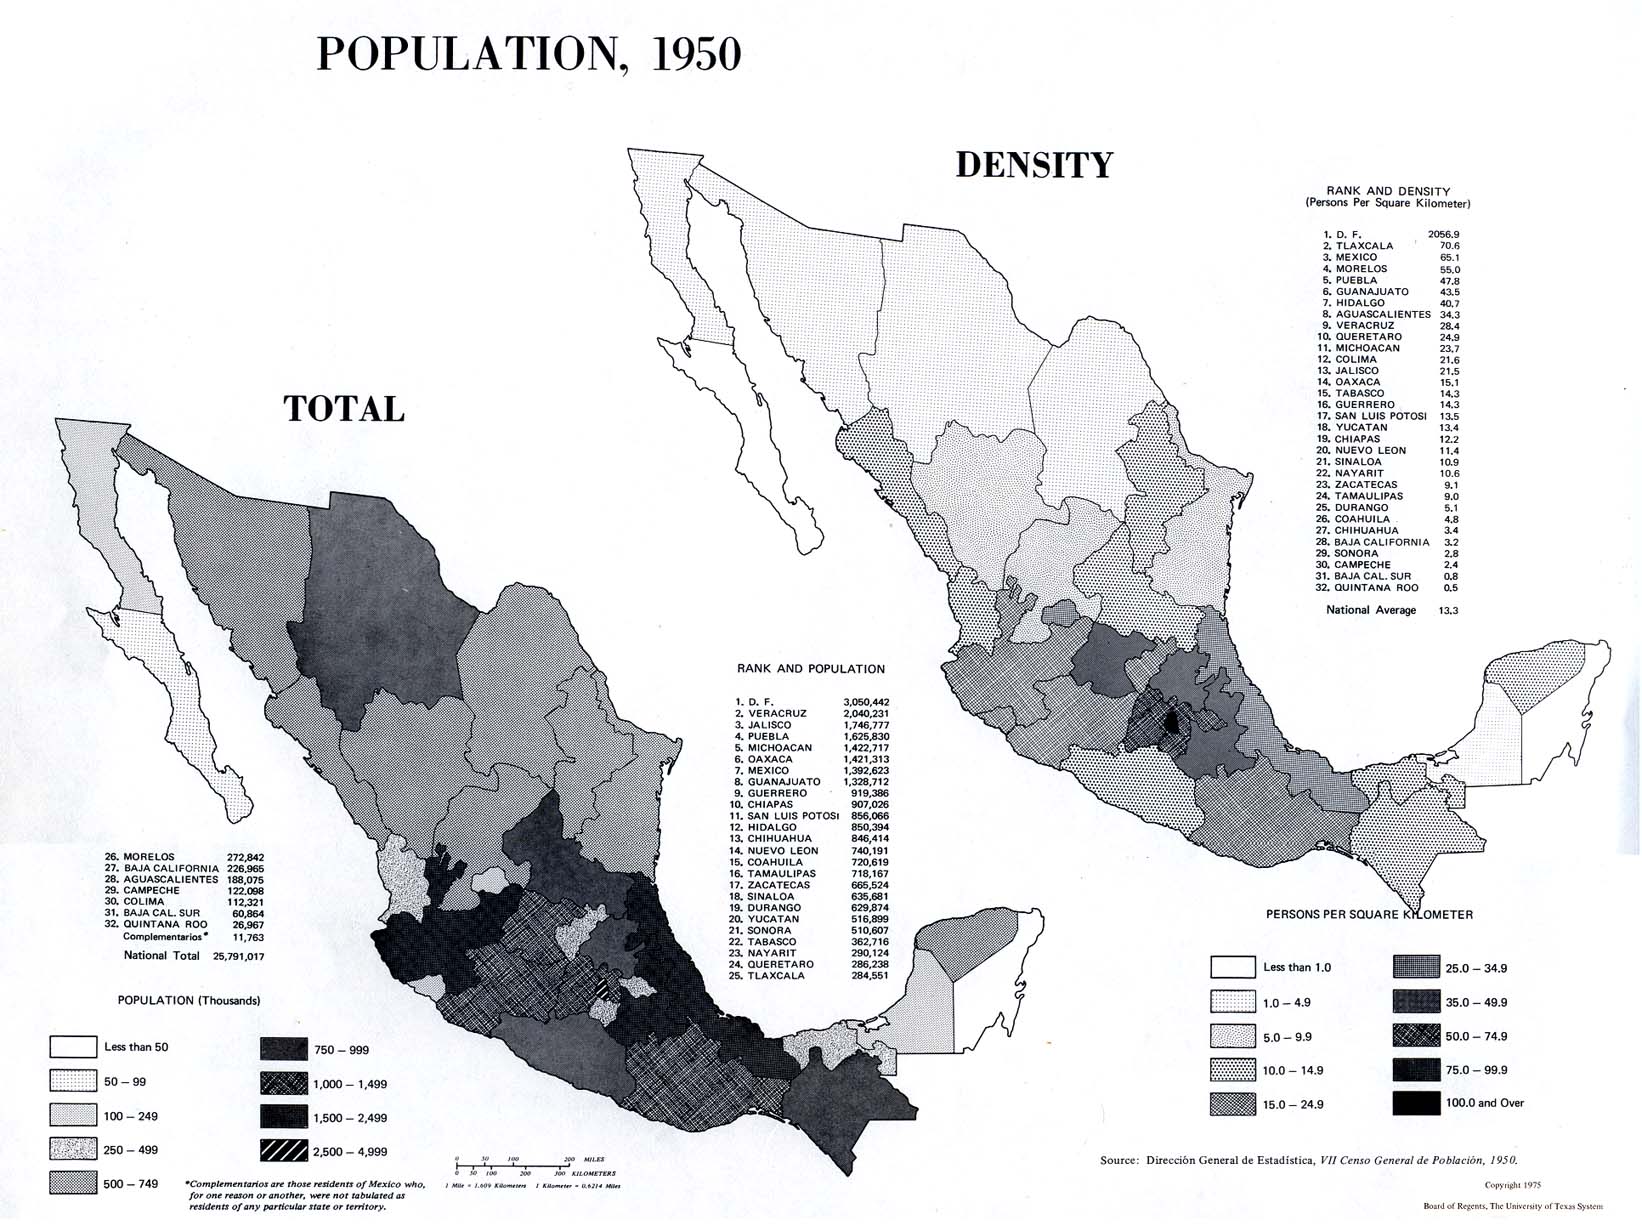
Population, 1950: Total; Density (372K)
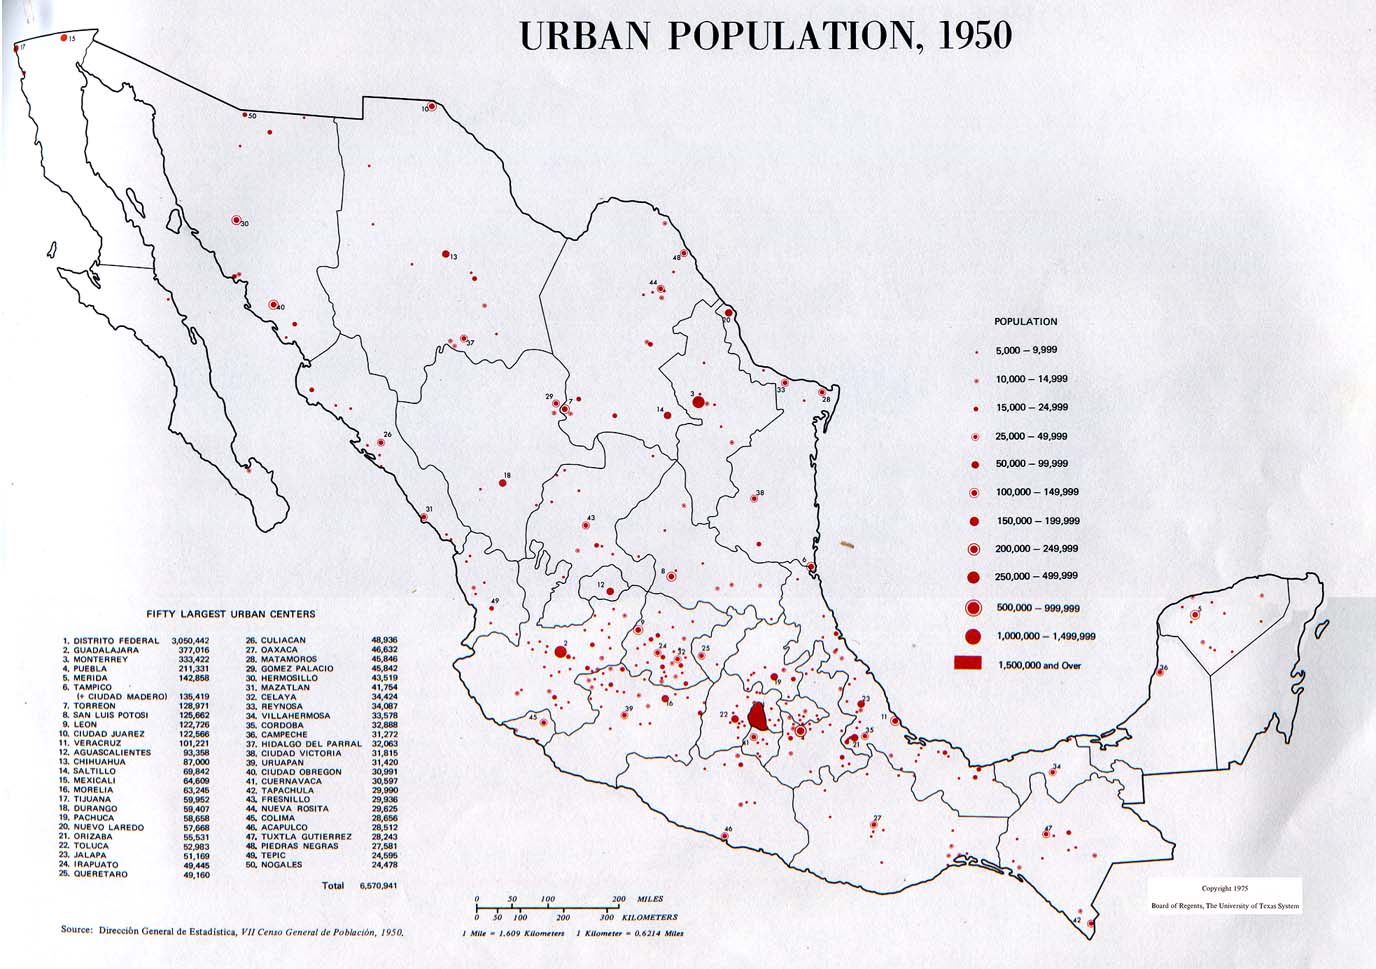
Urban Population, 1950 (174K)
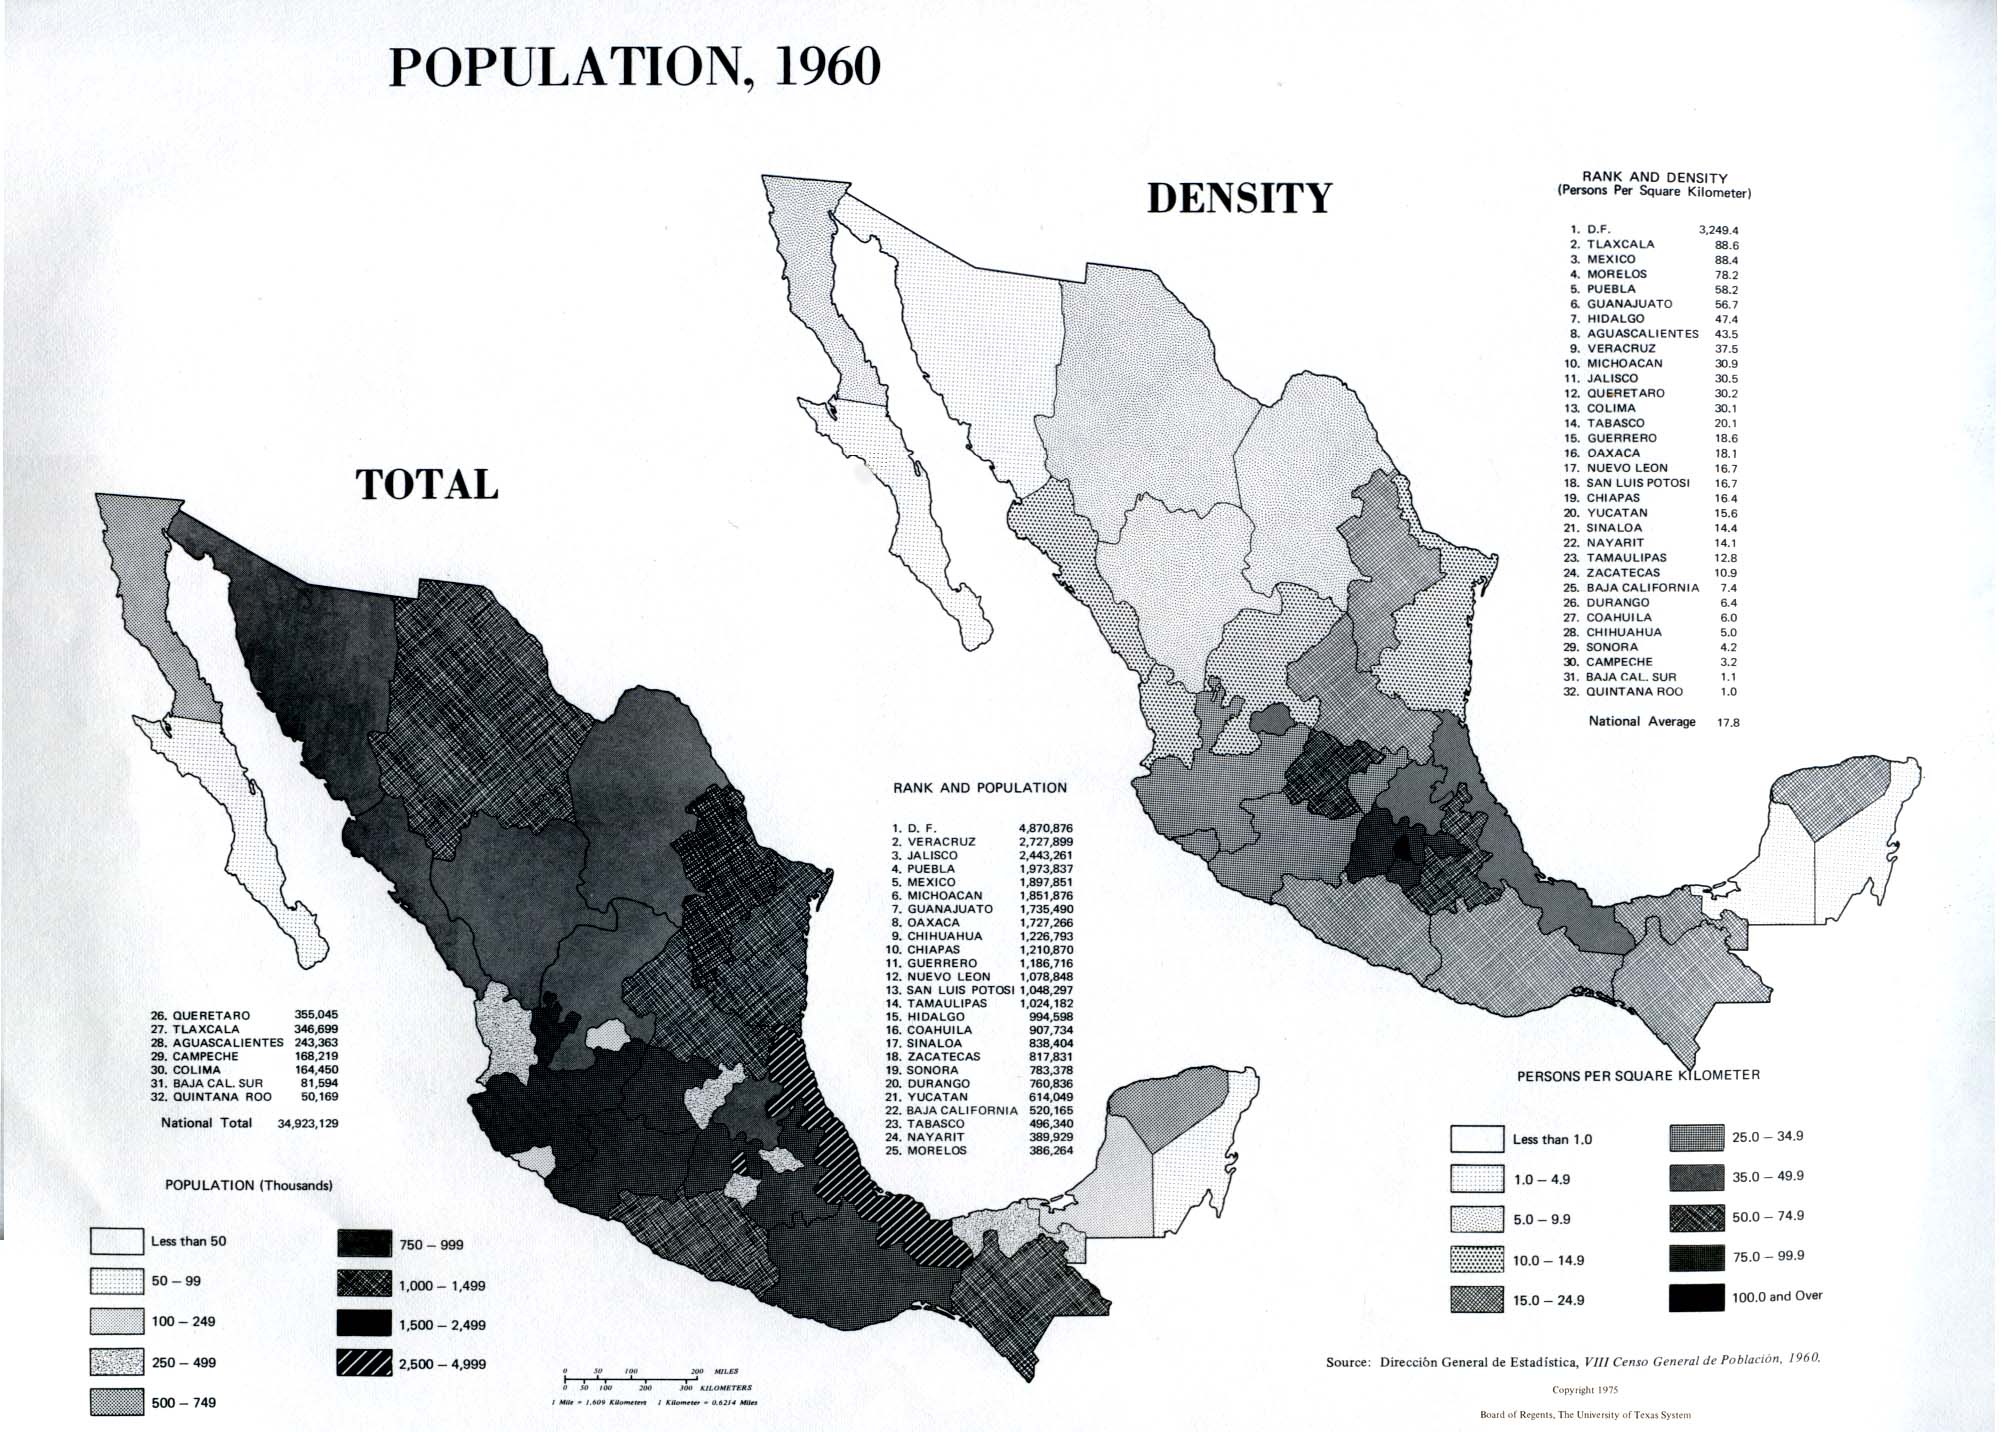
Population, 1960: Total; Density (389K)
Urban Population, 1960 (131K)
Population, 1970: Total; Density (137K)
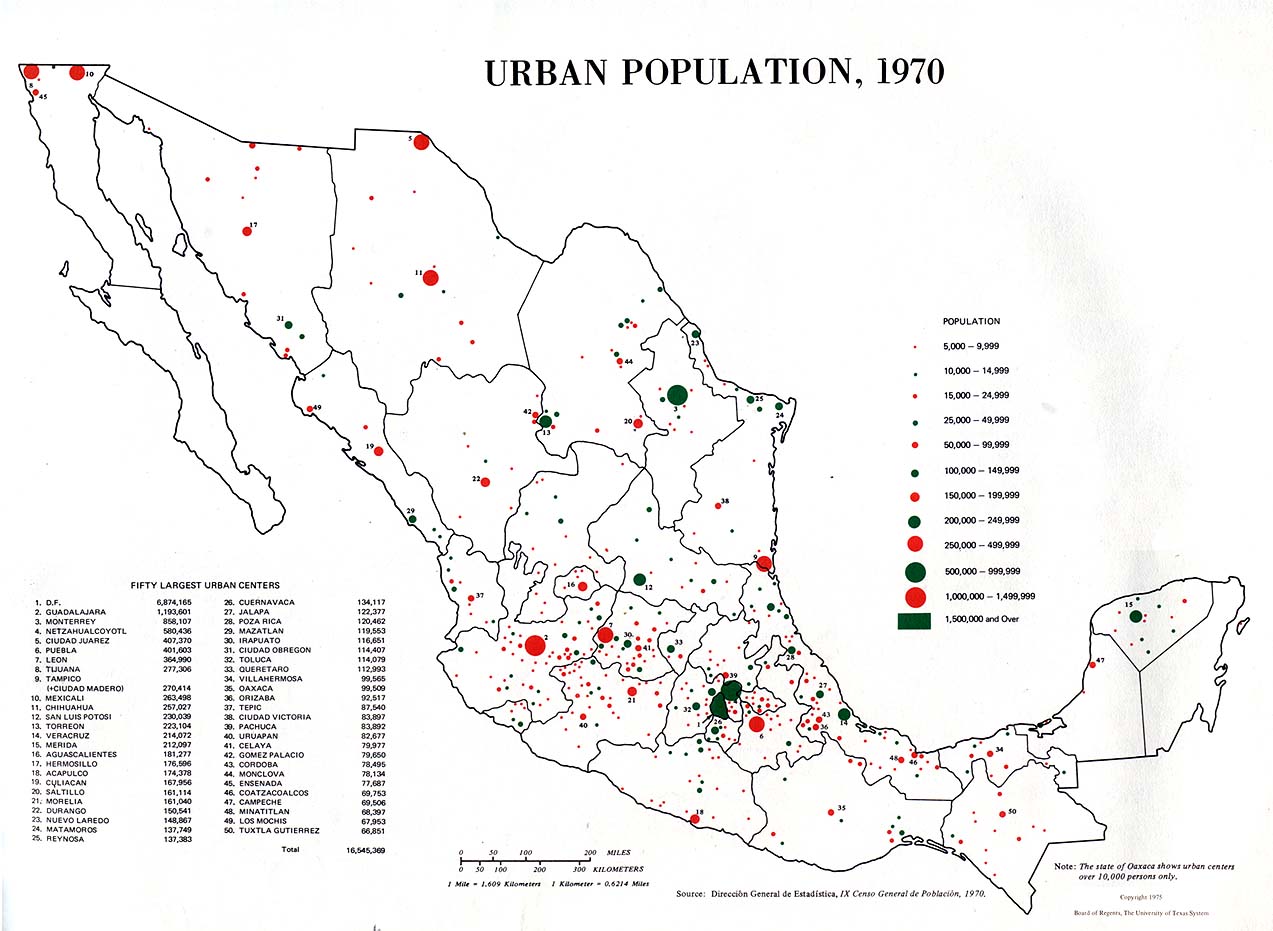
Urban Population, 1970 (175K)
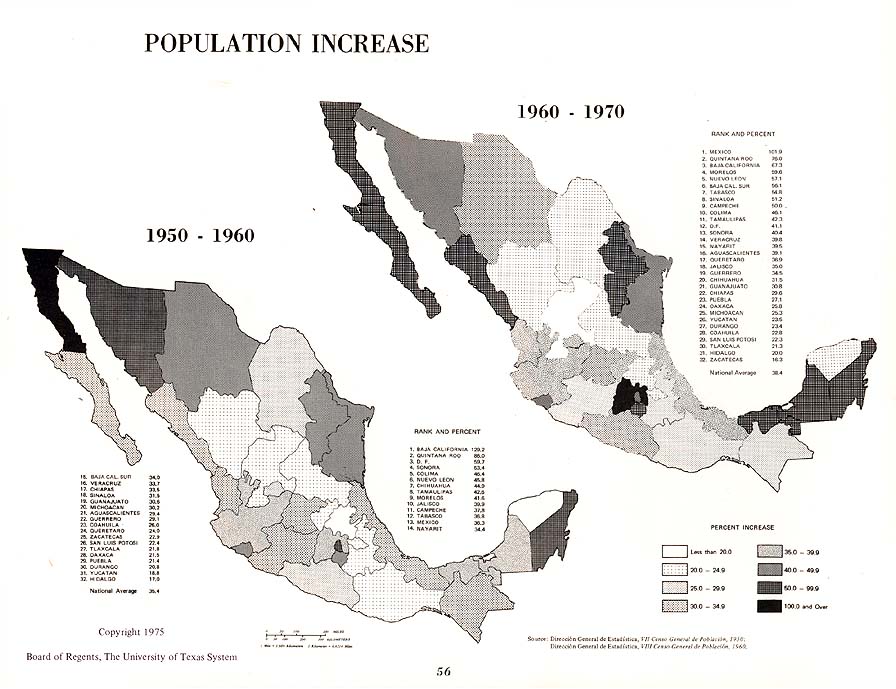
Population Increase: 1950-1960; 1960-1970 (128K)
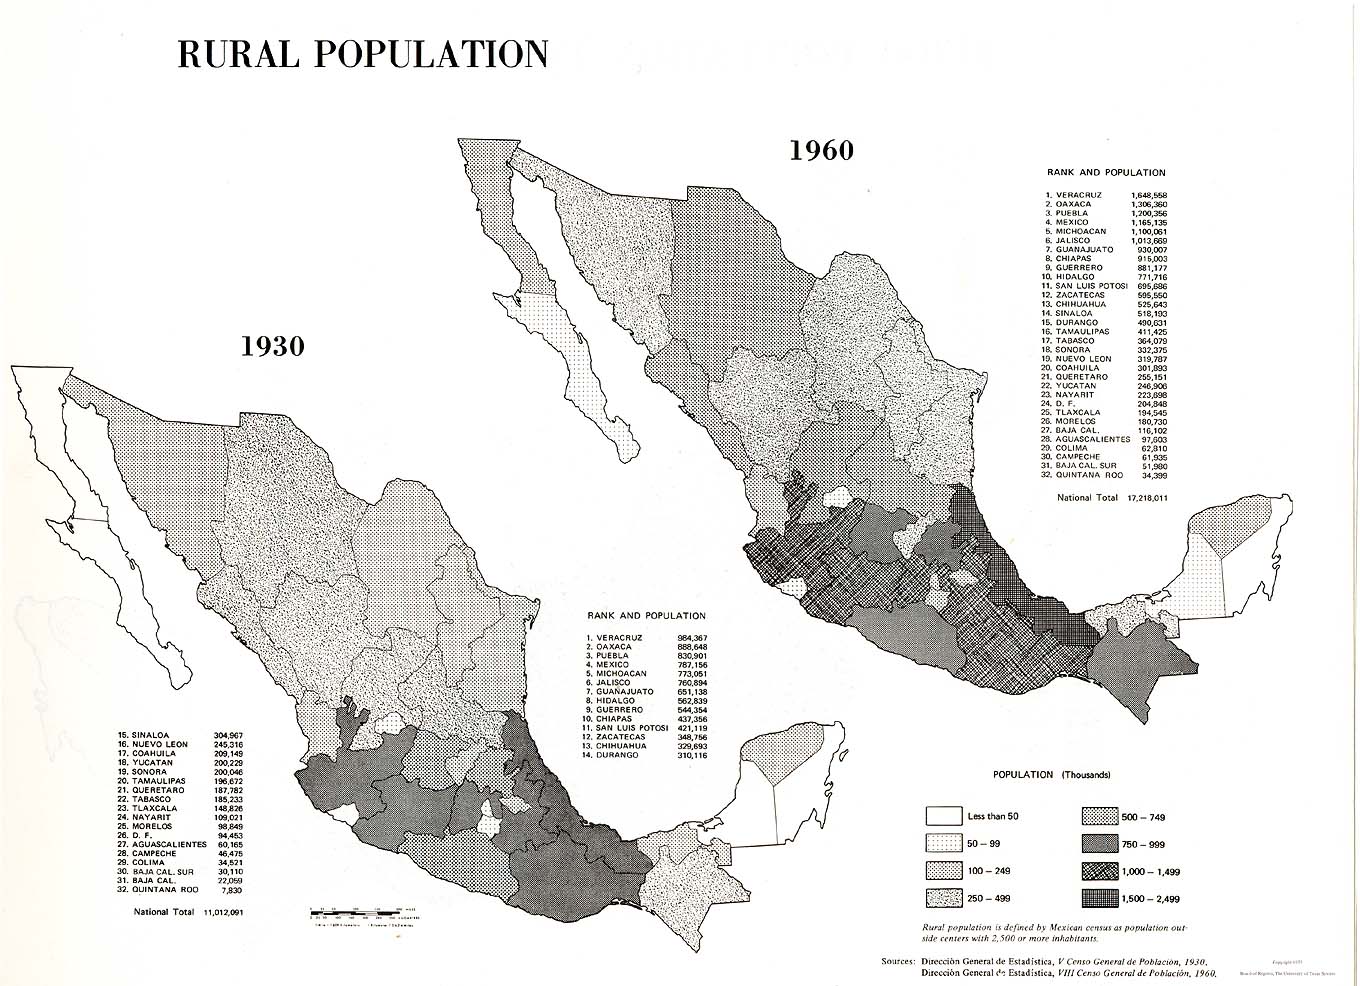
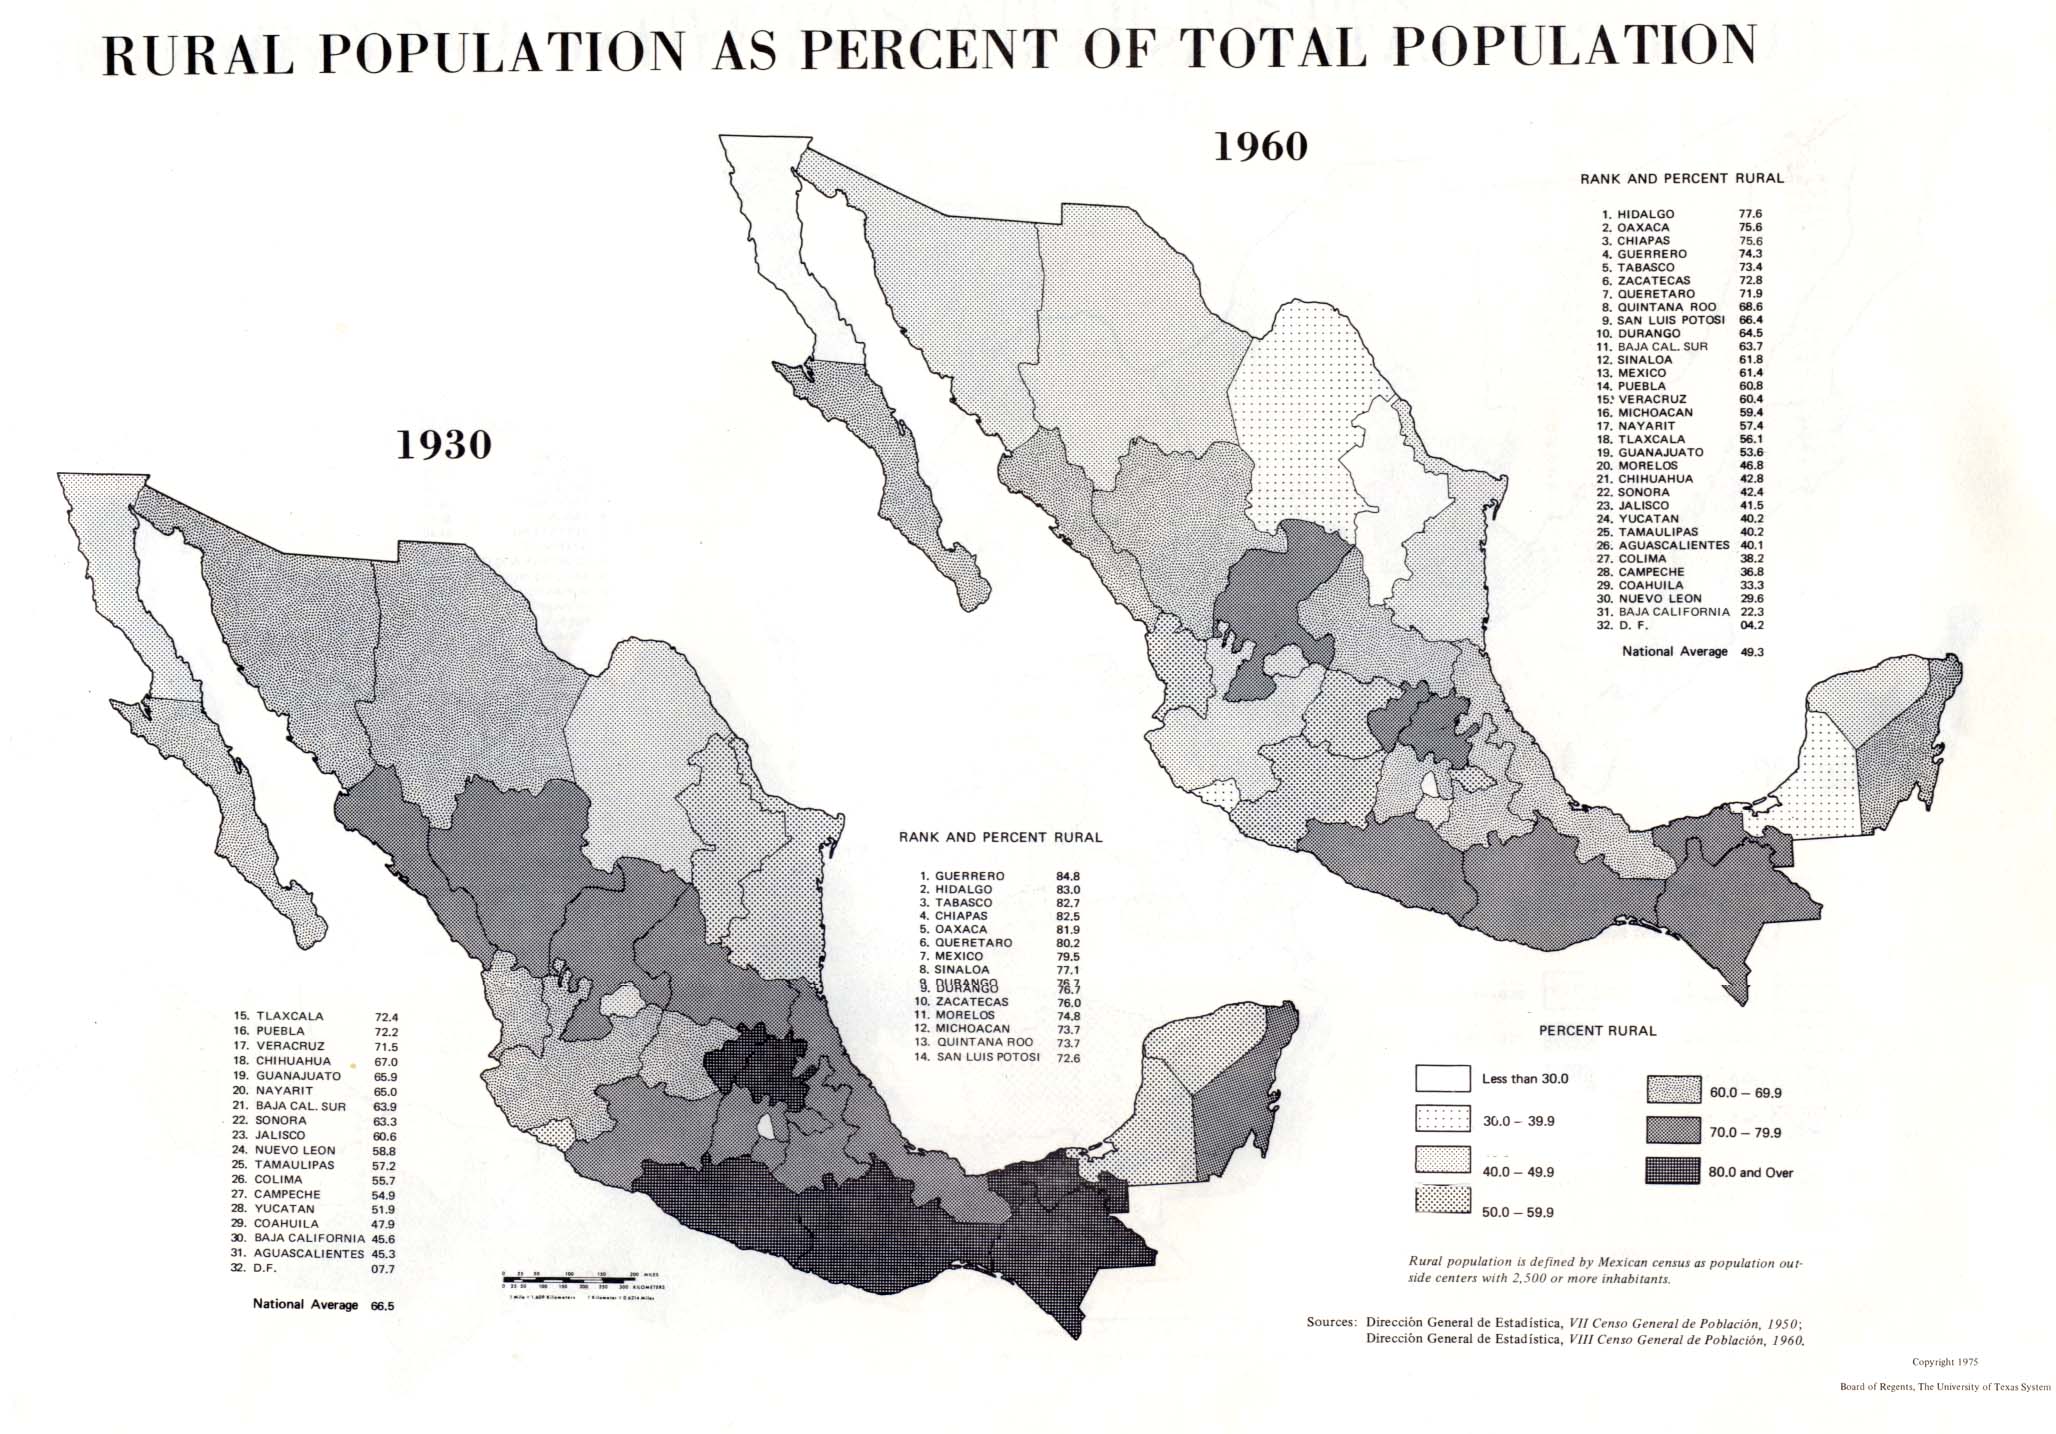
Rural Population: 1930; 1960 (276K)
Rural Population, 1970 (243K)
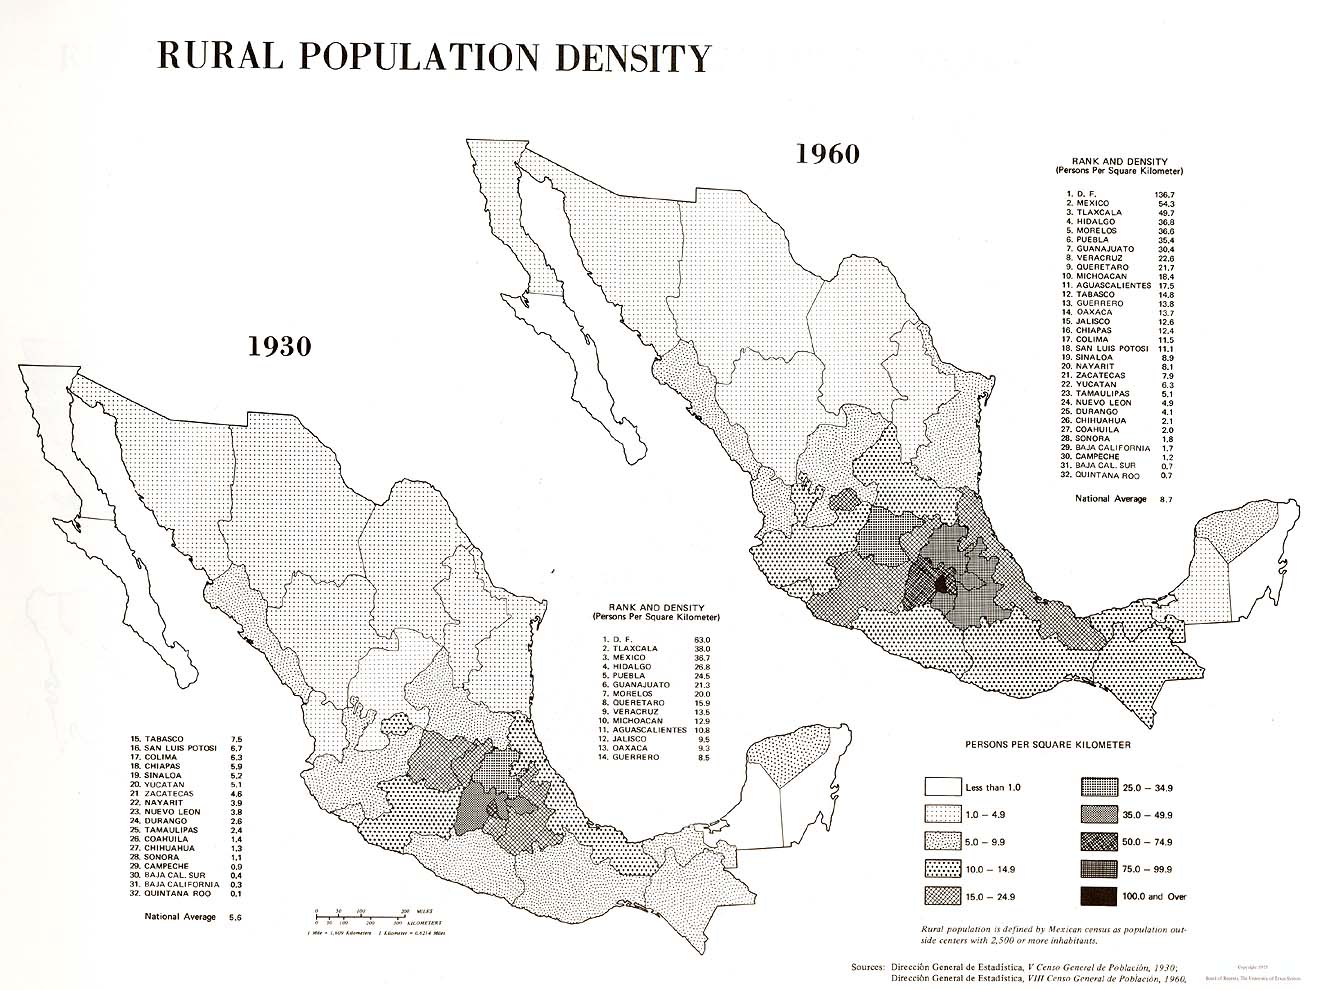
Rural Population Density: 1930; 1960 (392K)
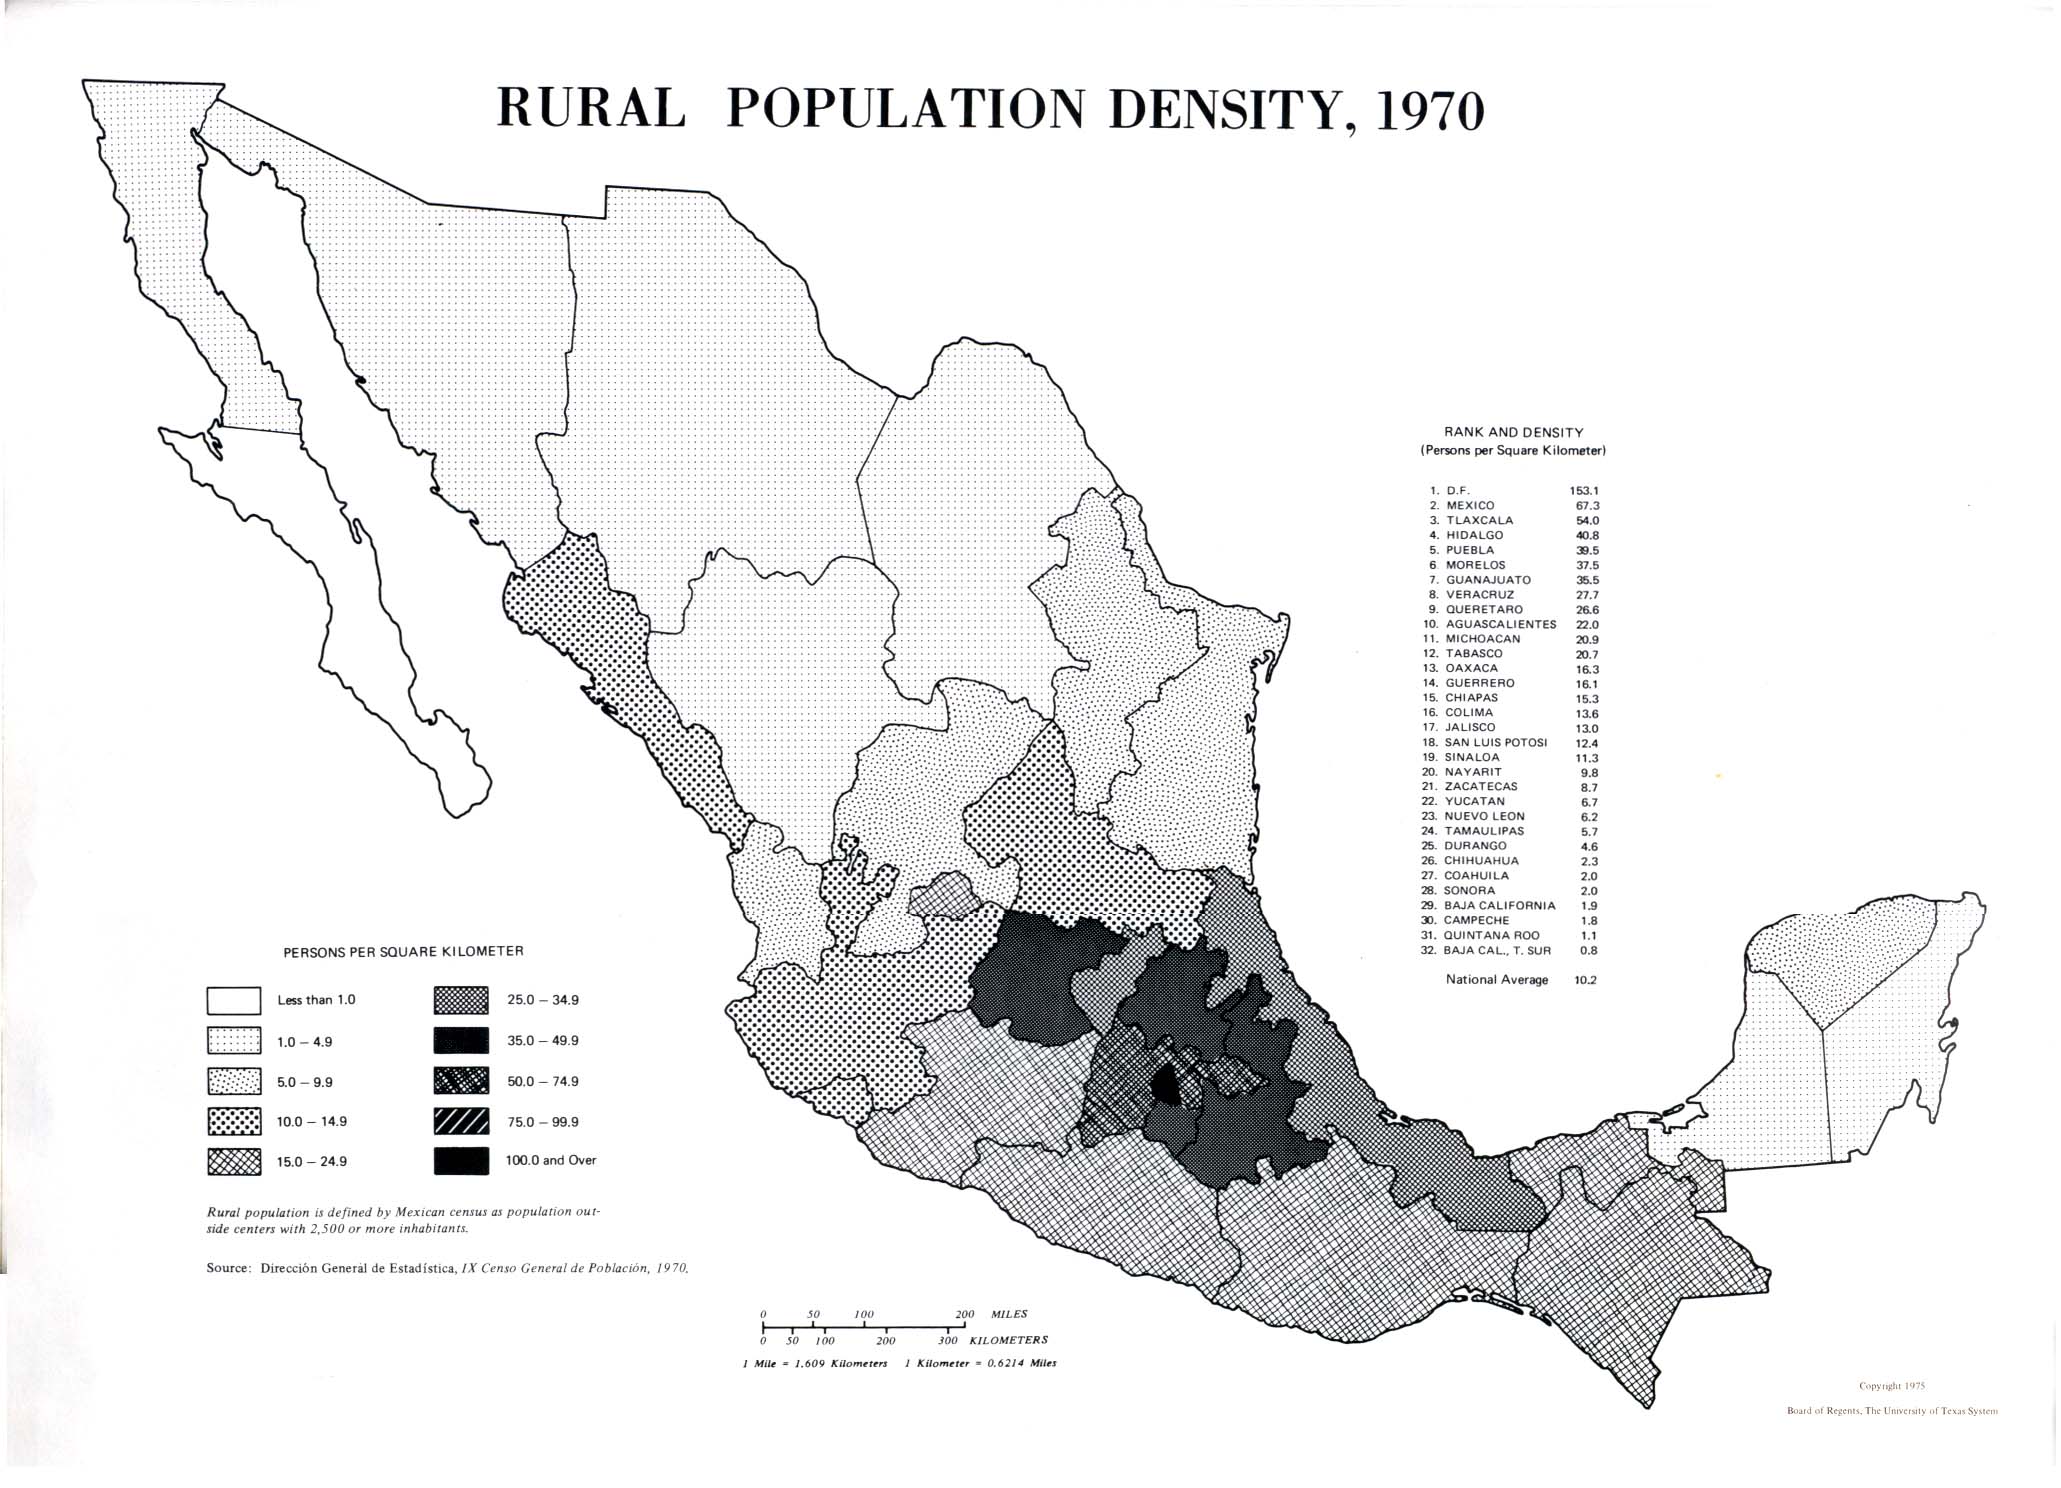
Rural Population Density, 1970 (392K)
Rural Population as Percent of Total Population, 1930; 1960 (394K)
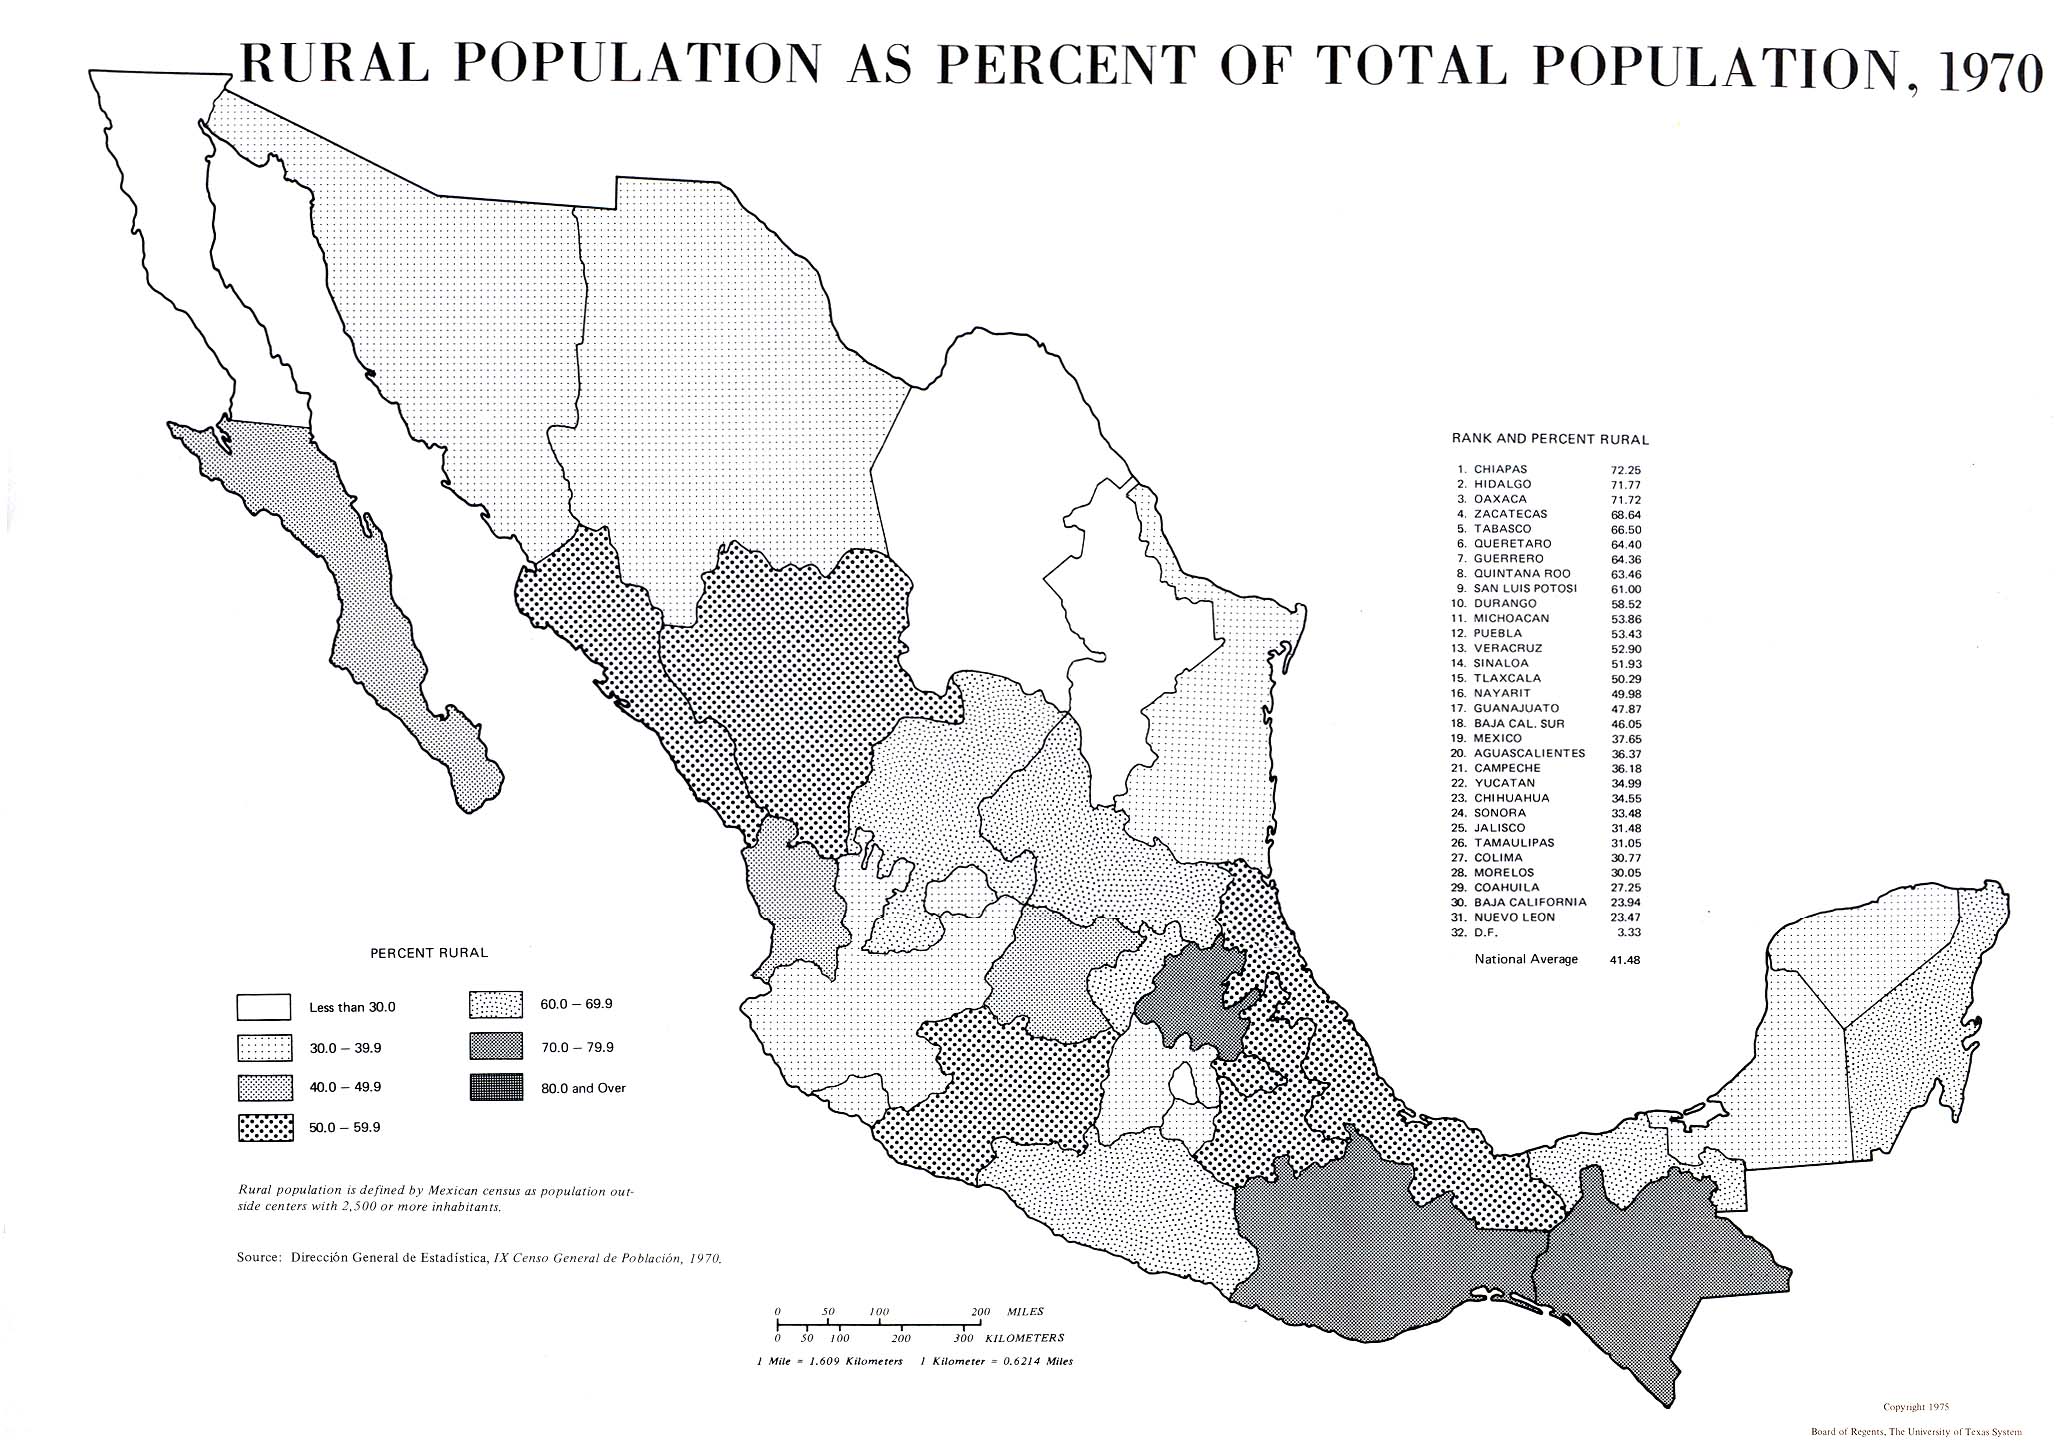
Rural Population as Percent of Total Population, 1970 (474K)
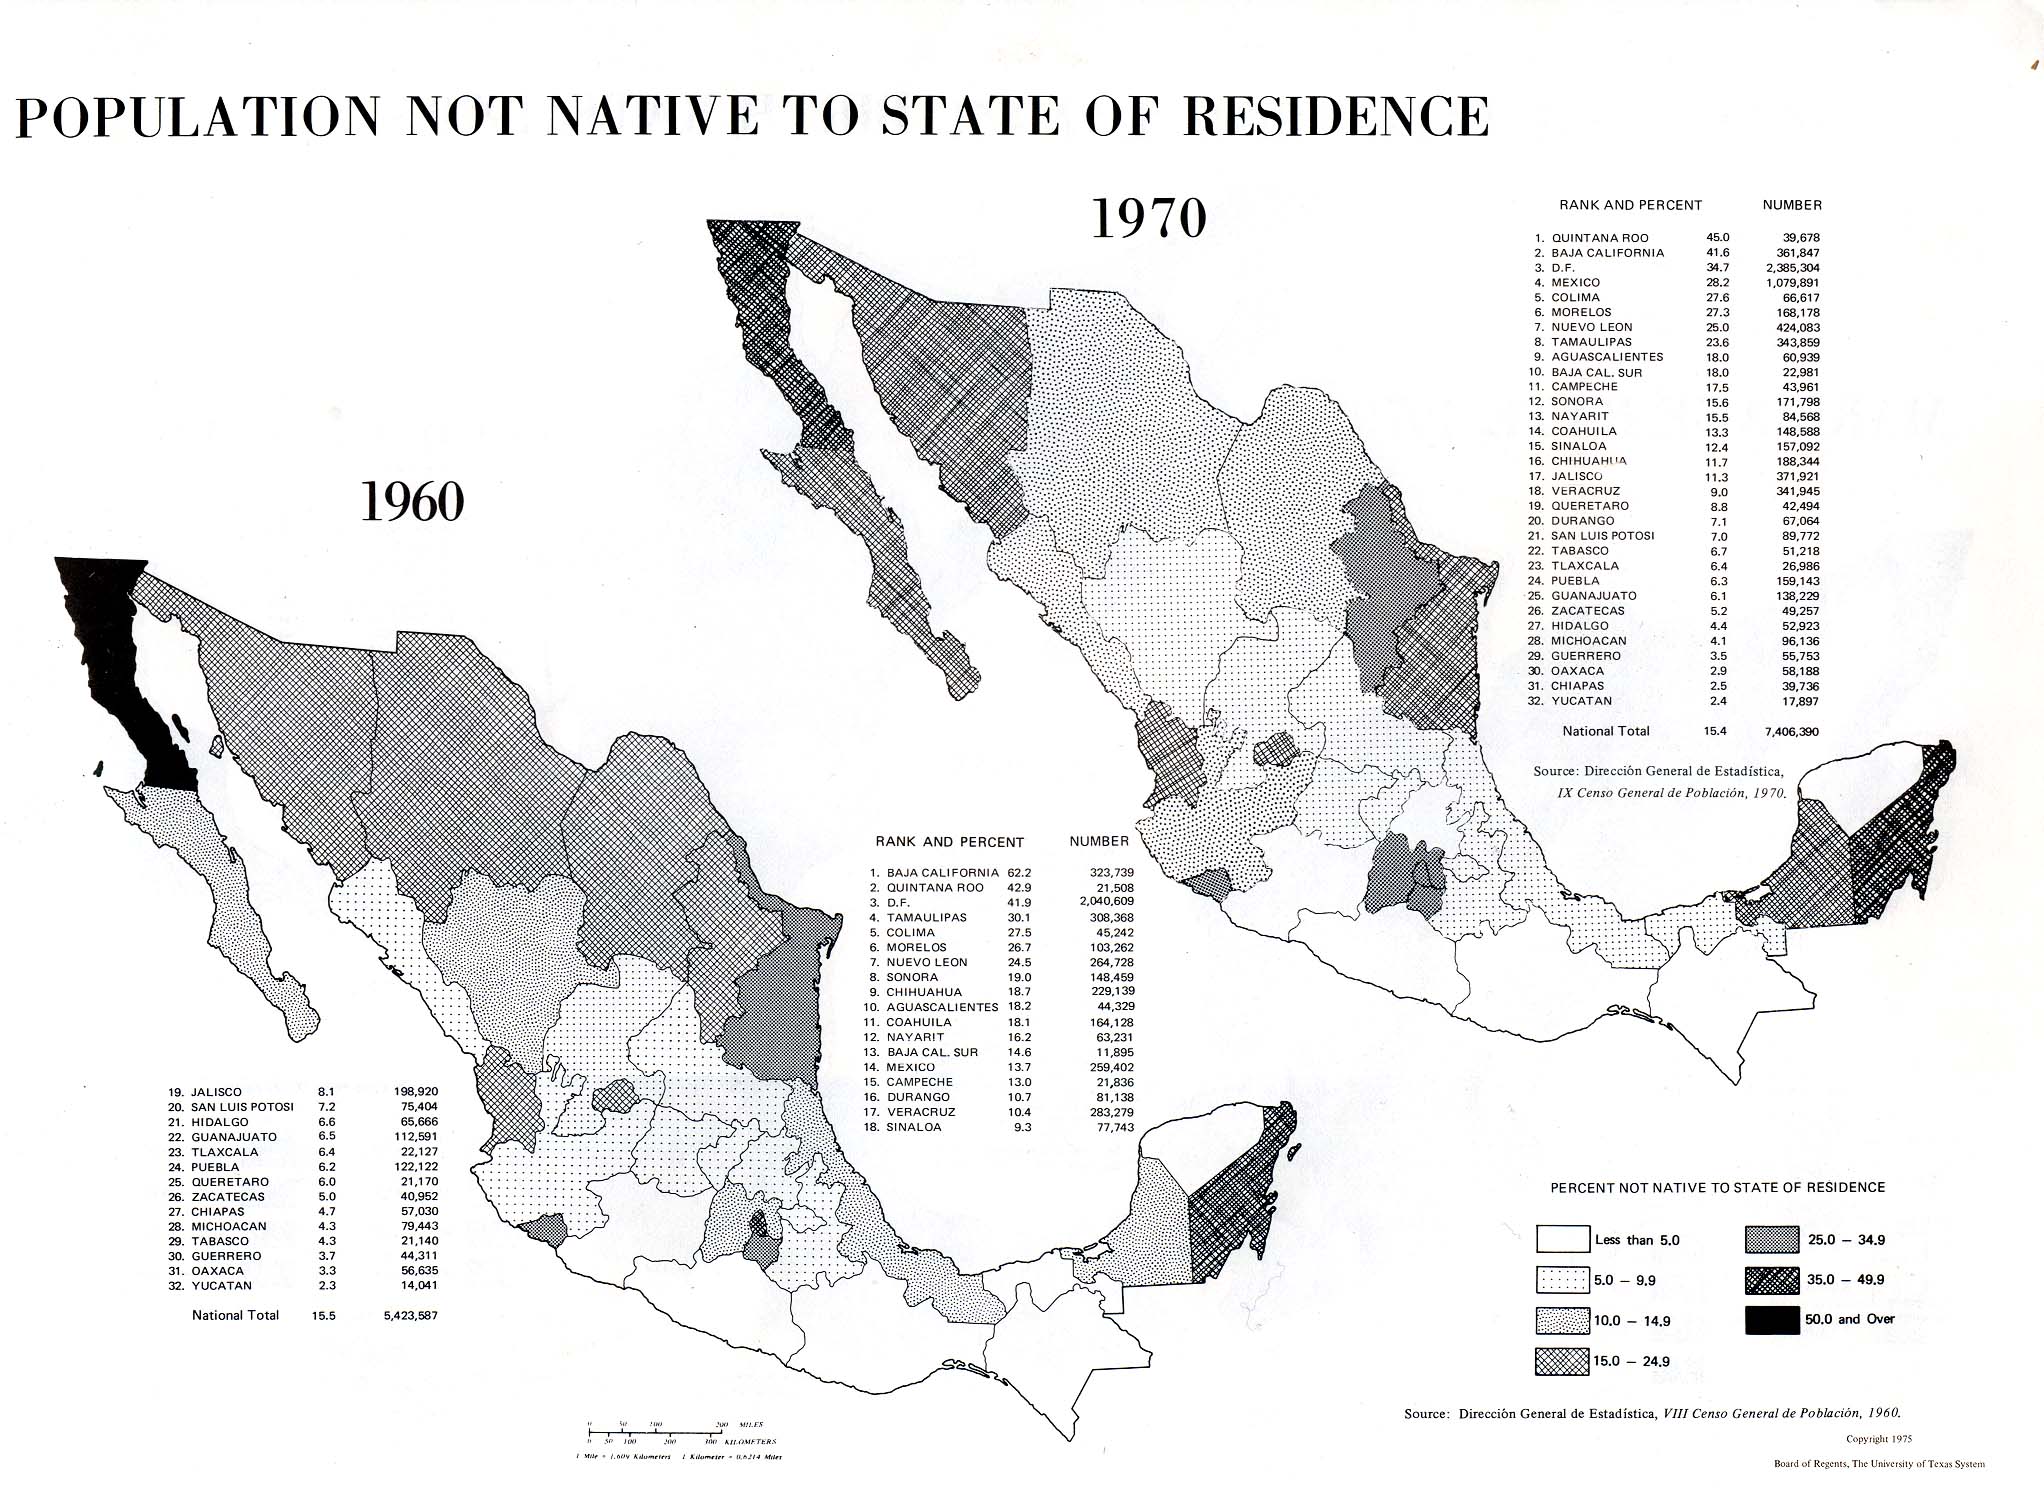
Population Not Native to State of Residence (533K)
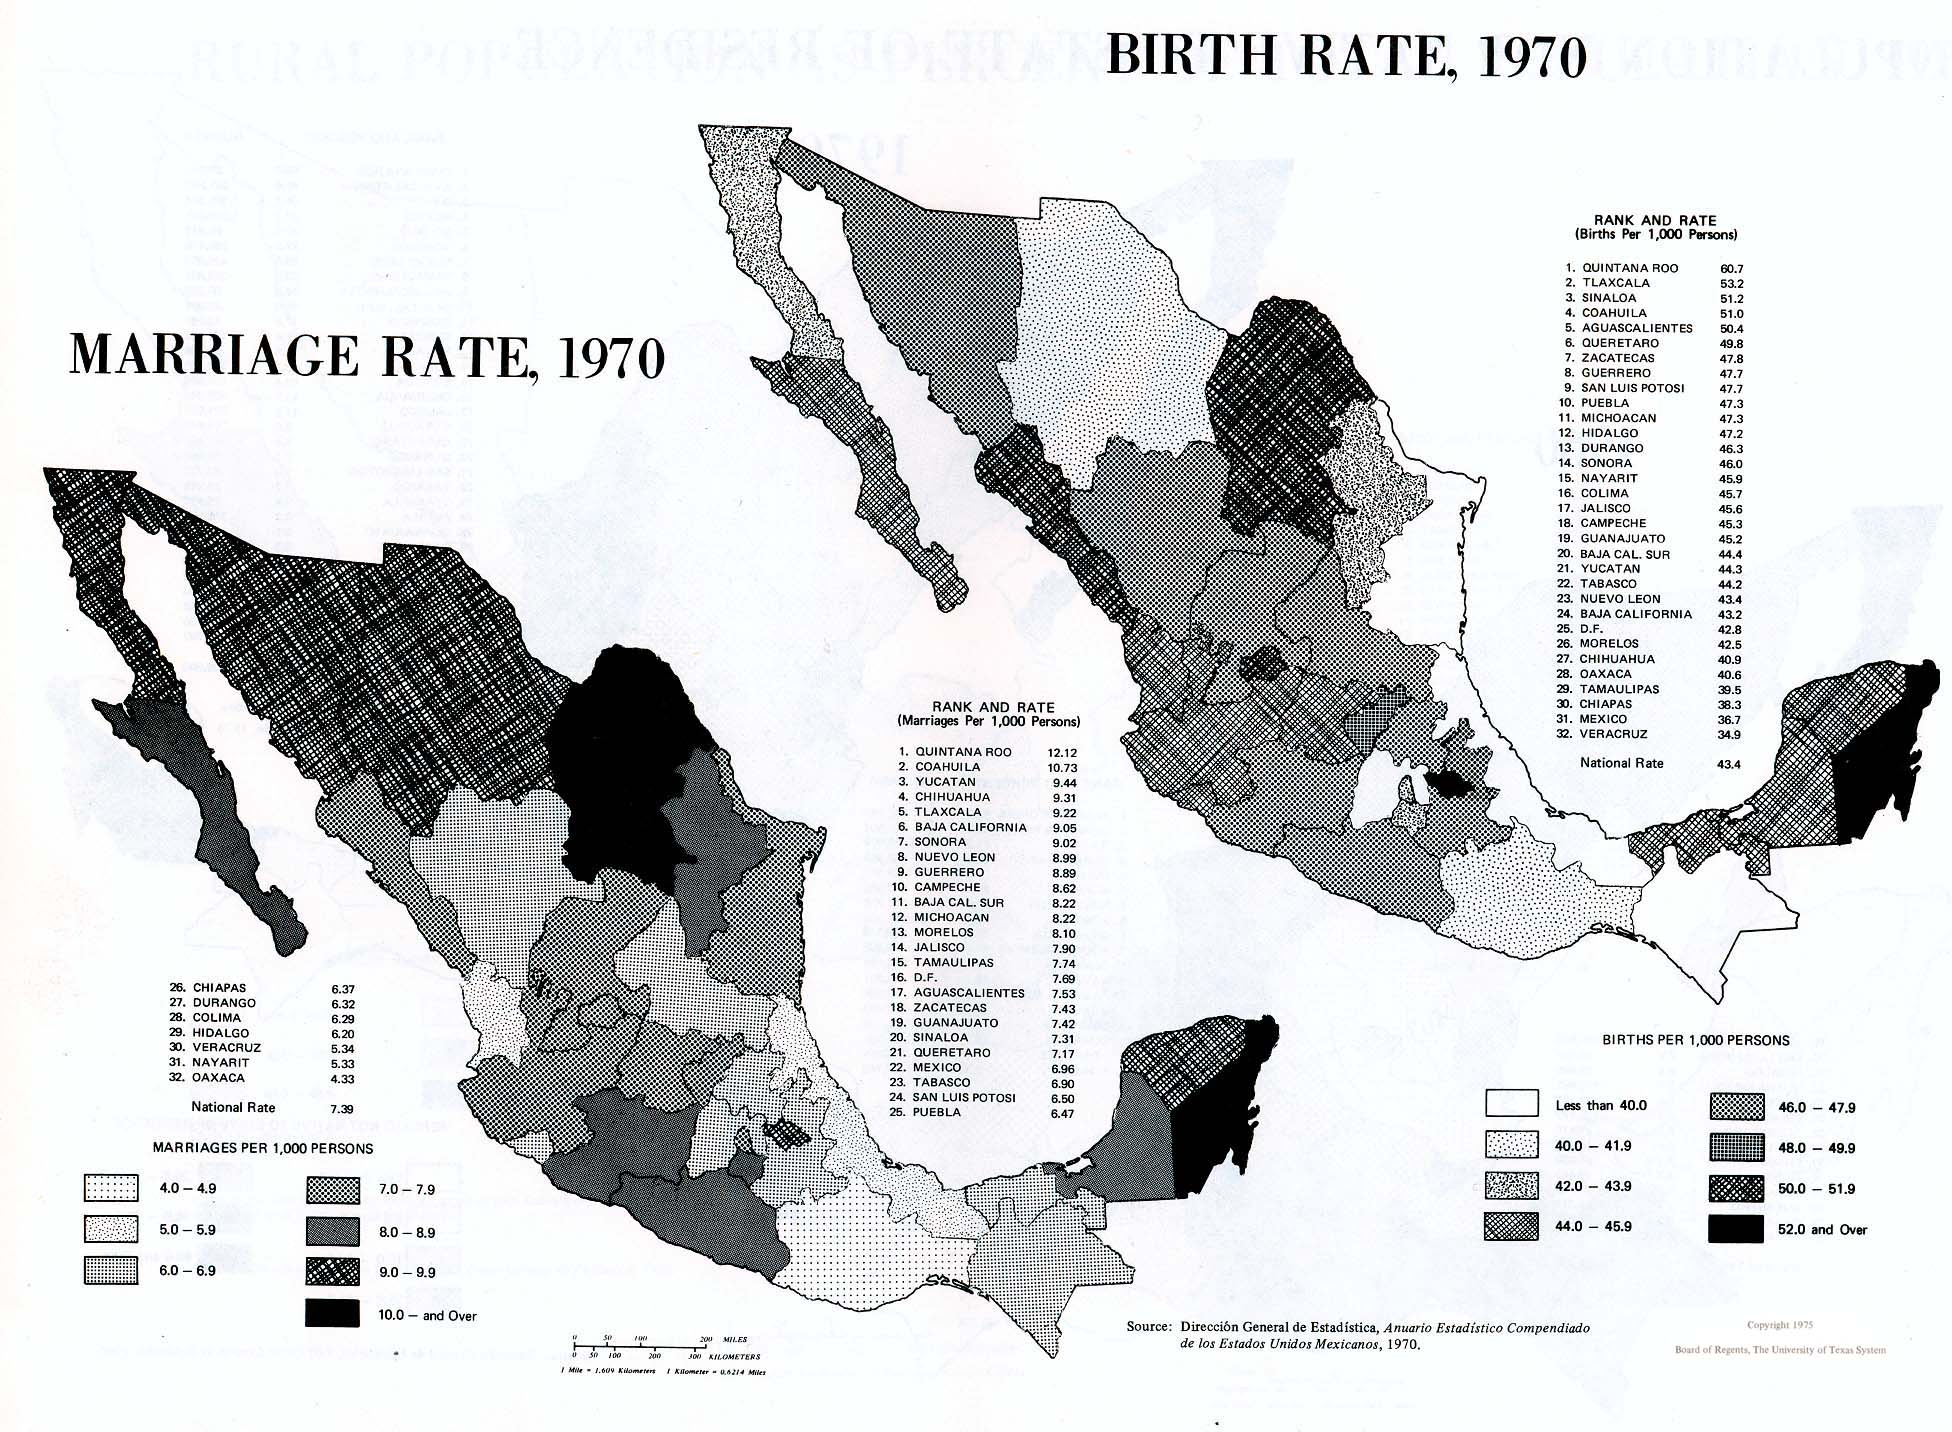
Marriage Rate and Birth Rate, 1970 (564K)
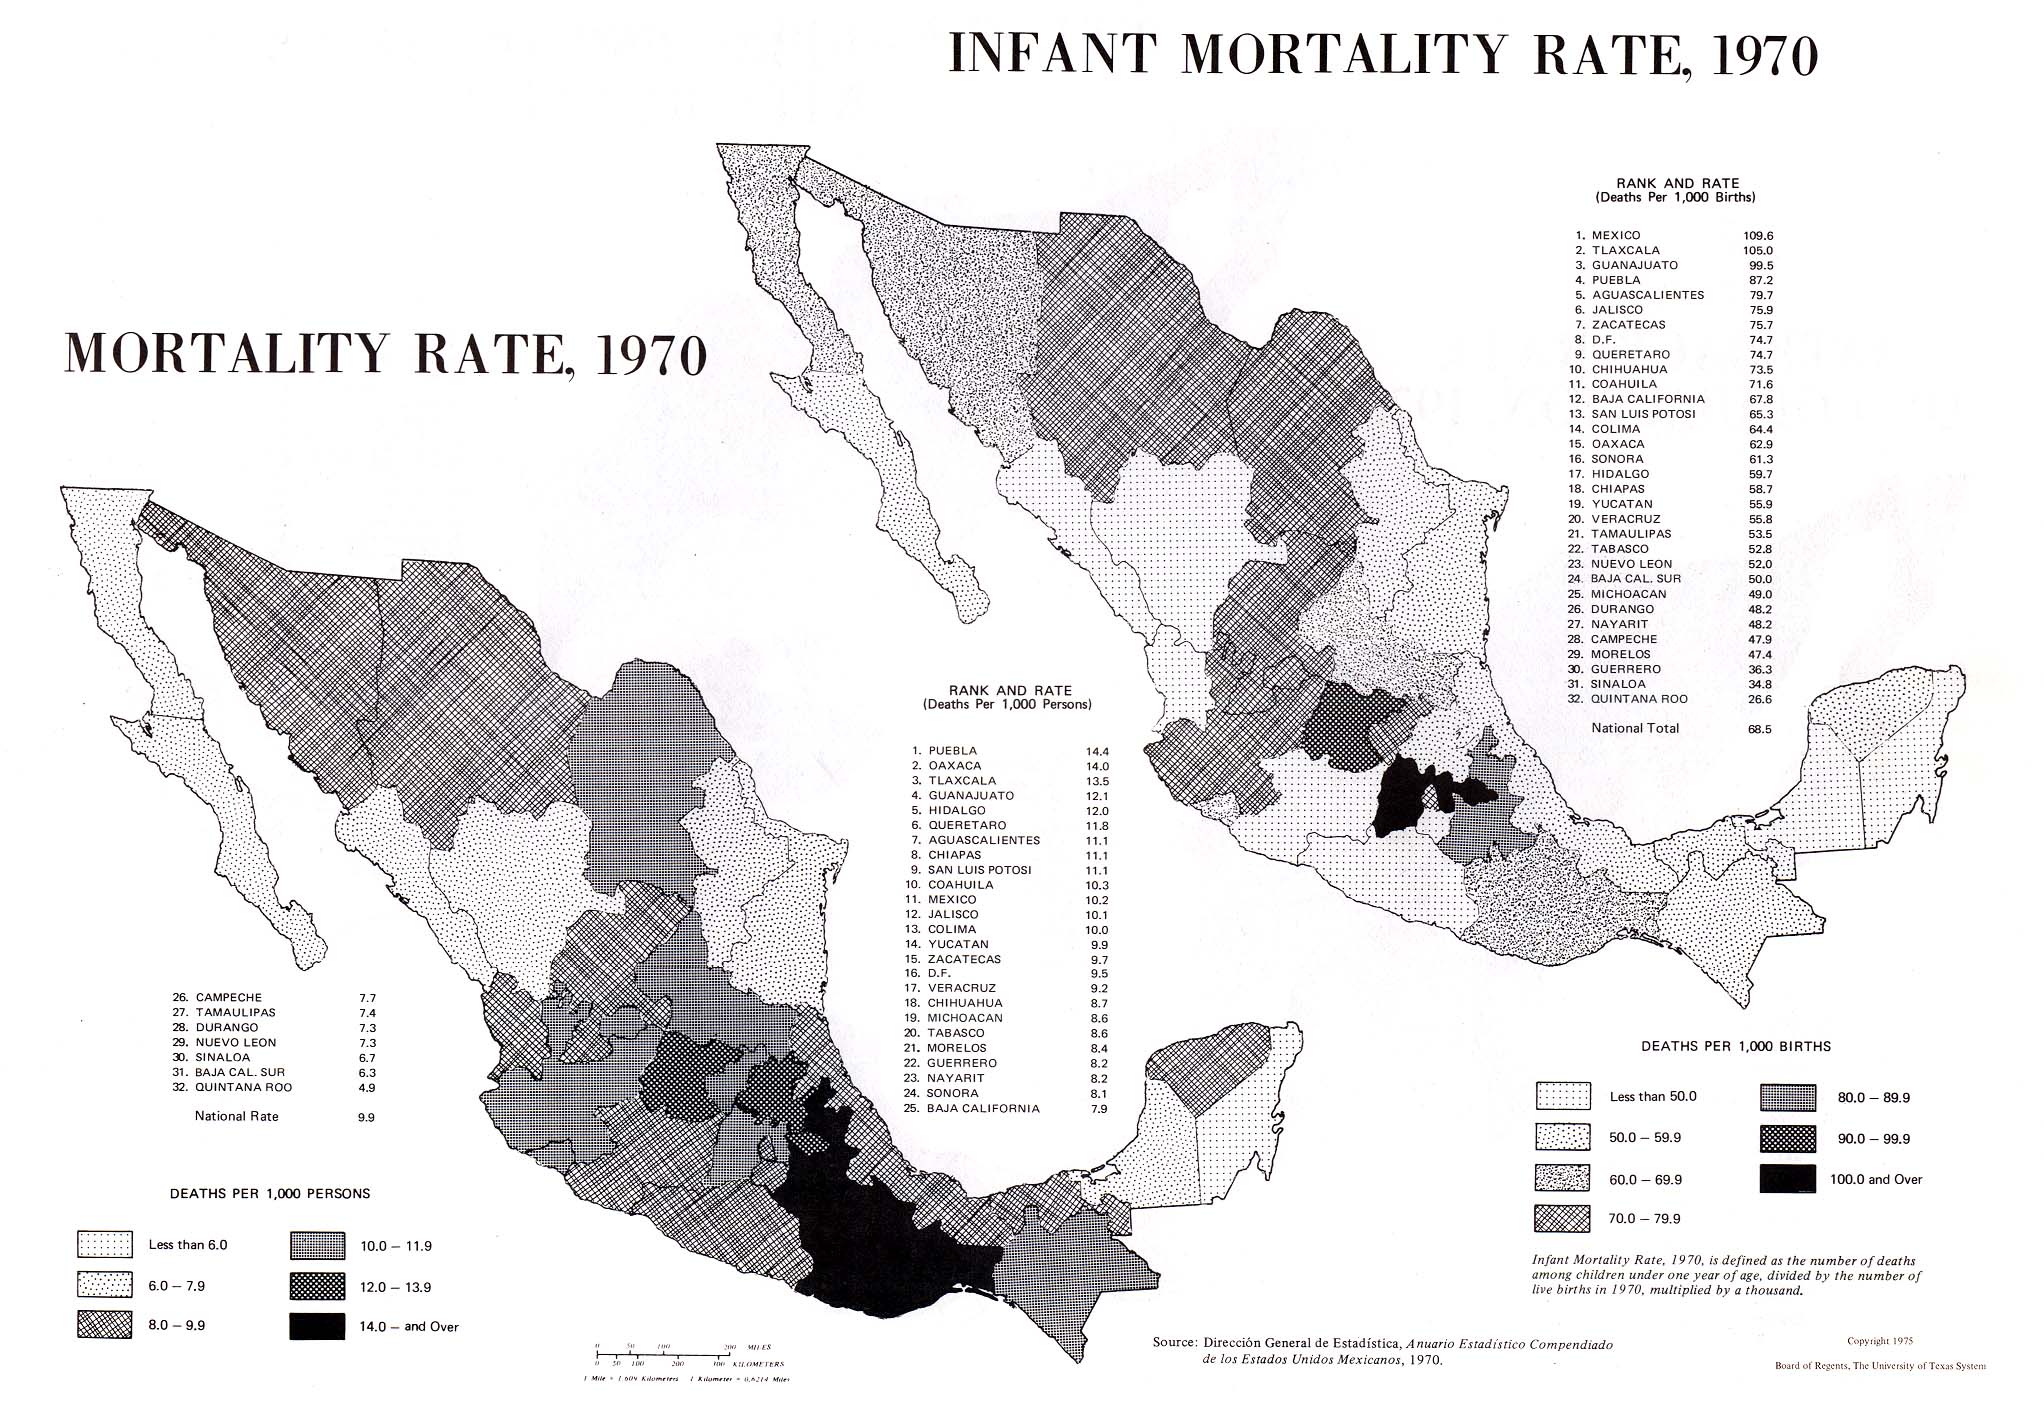
Mortality Rate and Infant Mortality Rate, 1970 (560K)
Literacy Rate of Population and Percent of Dwellings with Running Water, 1970 (422K)
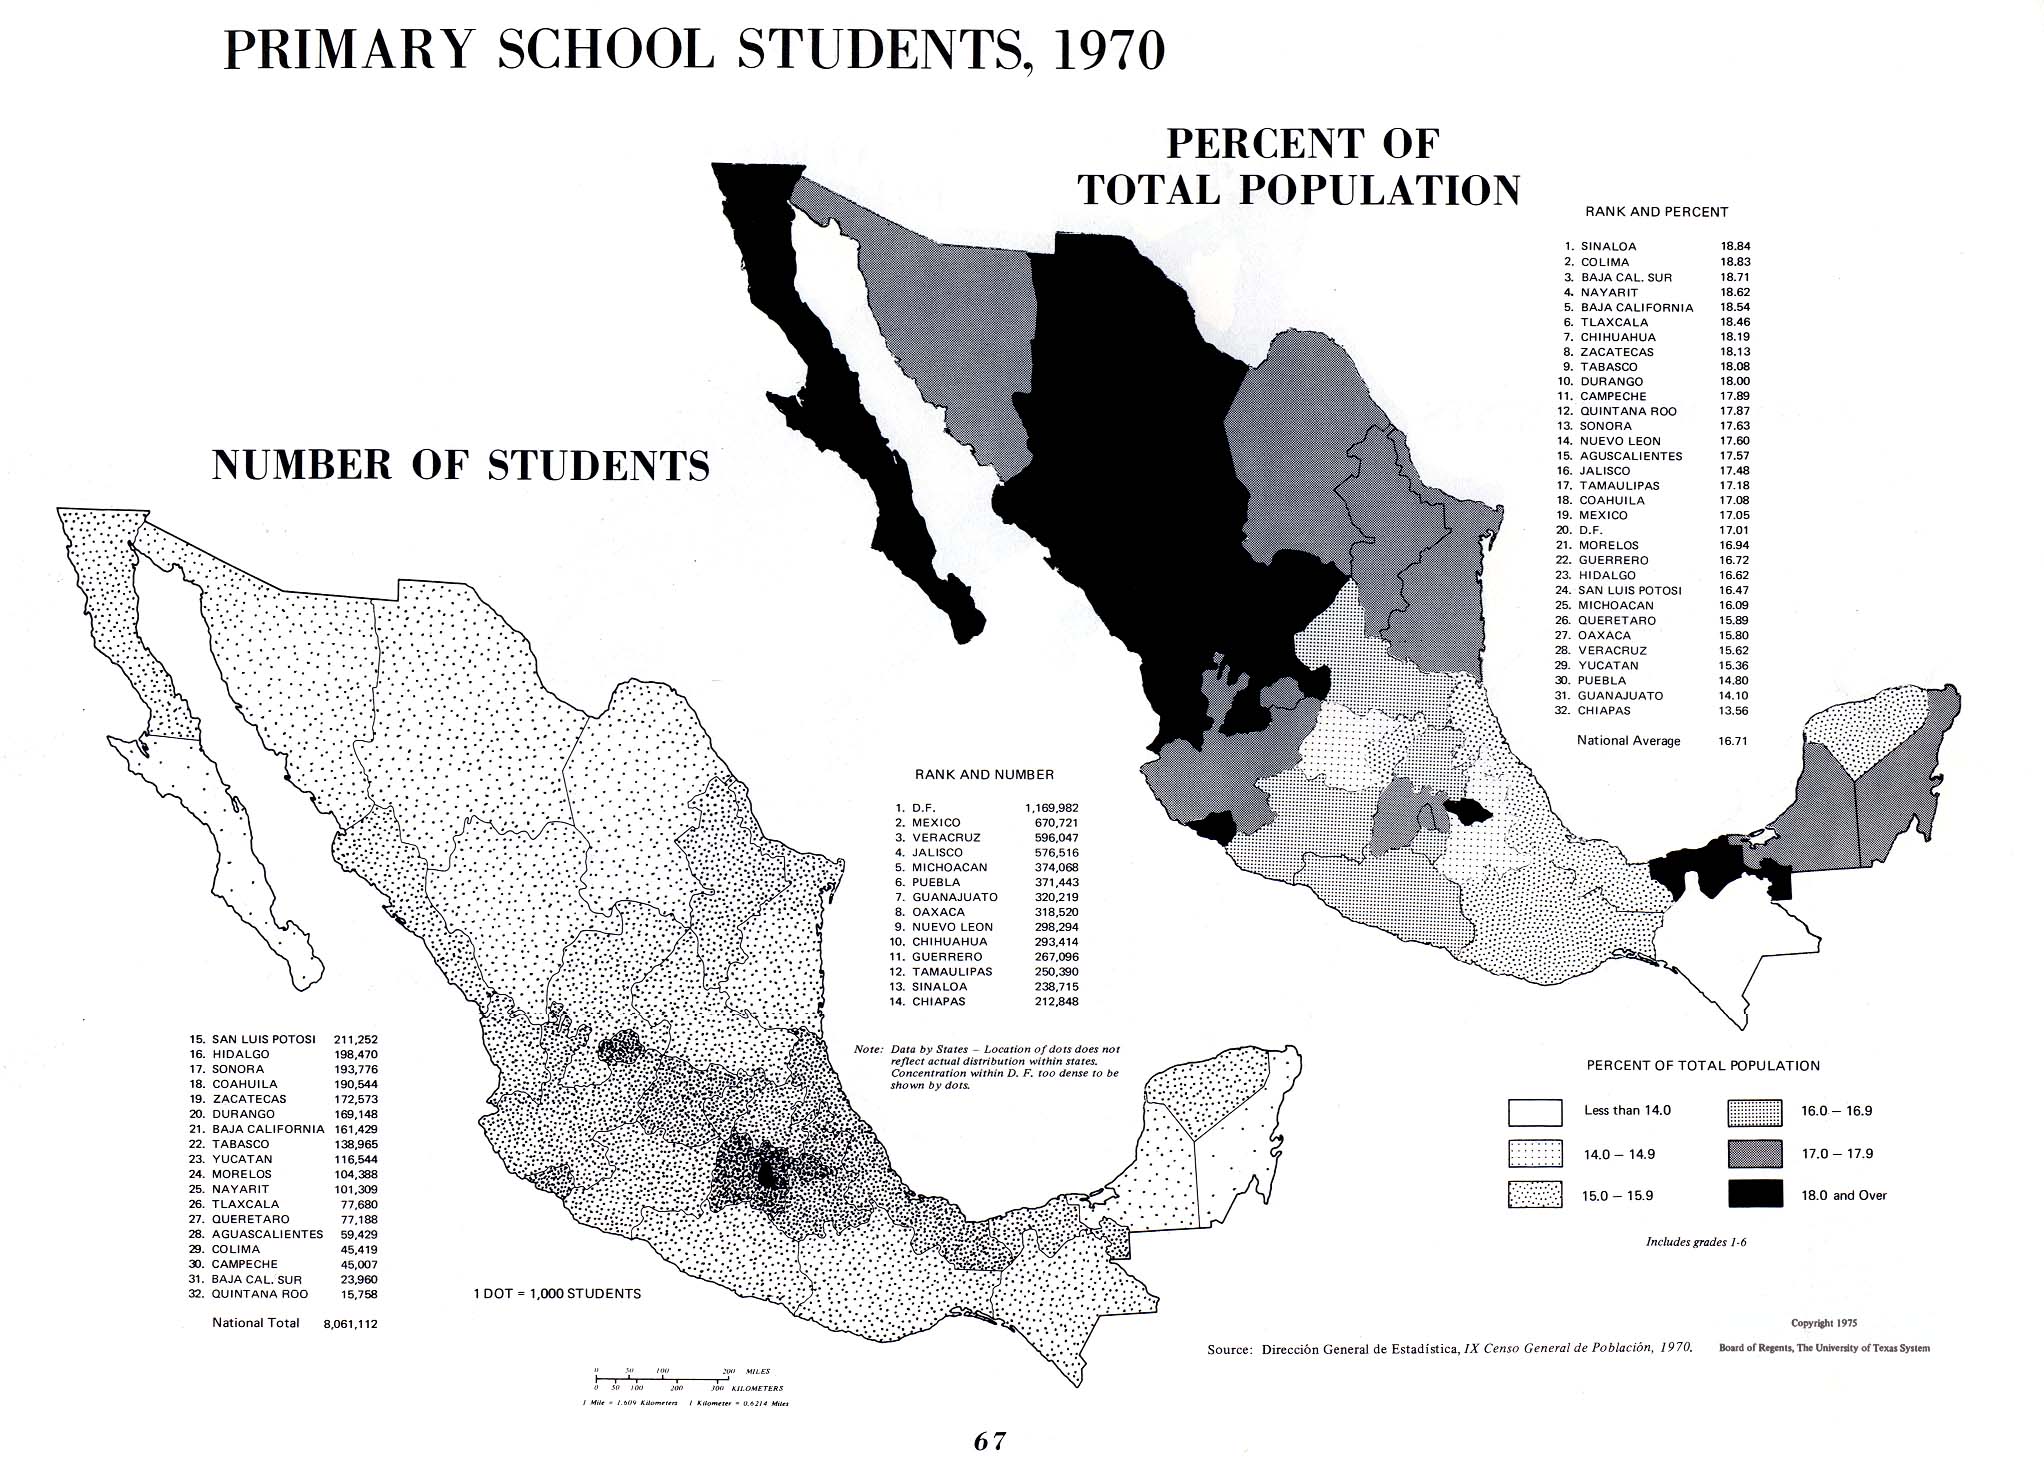
Primary School Students, 1970: Number of Students; Percent of Total Population (465K)
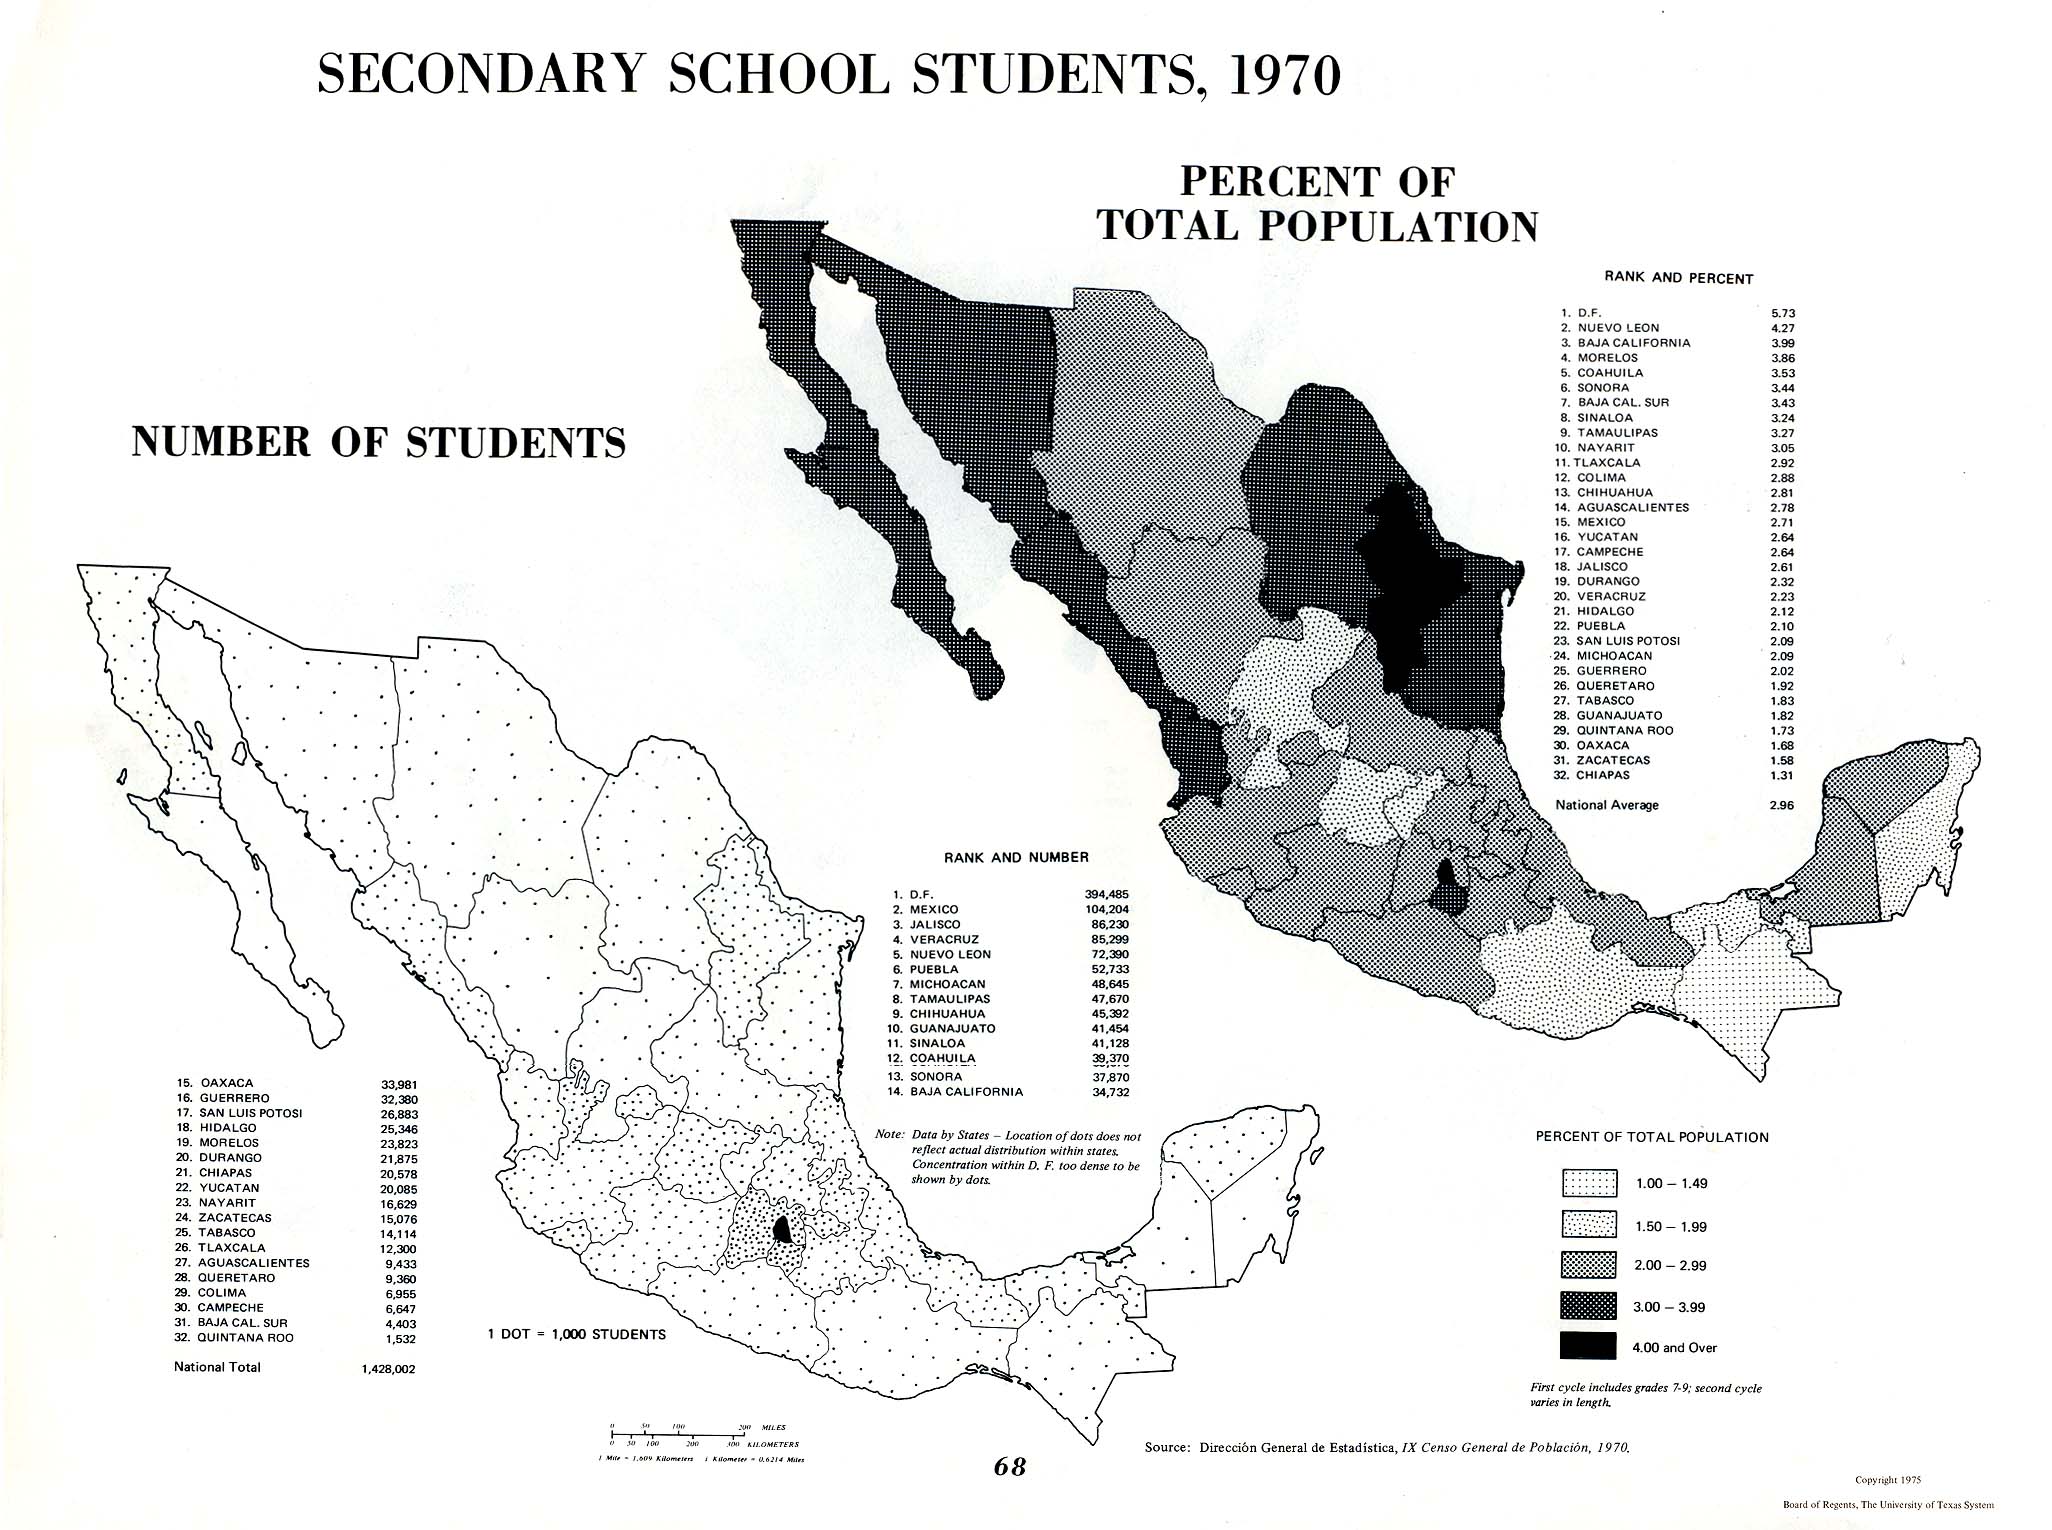
Secondary School Students, 1970: Number of Students; Percent of Total Population (438K)
Higher Education Enrollment, 1970: Number of Students; Students per 10,000 Population (451K)
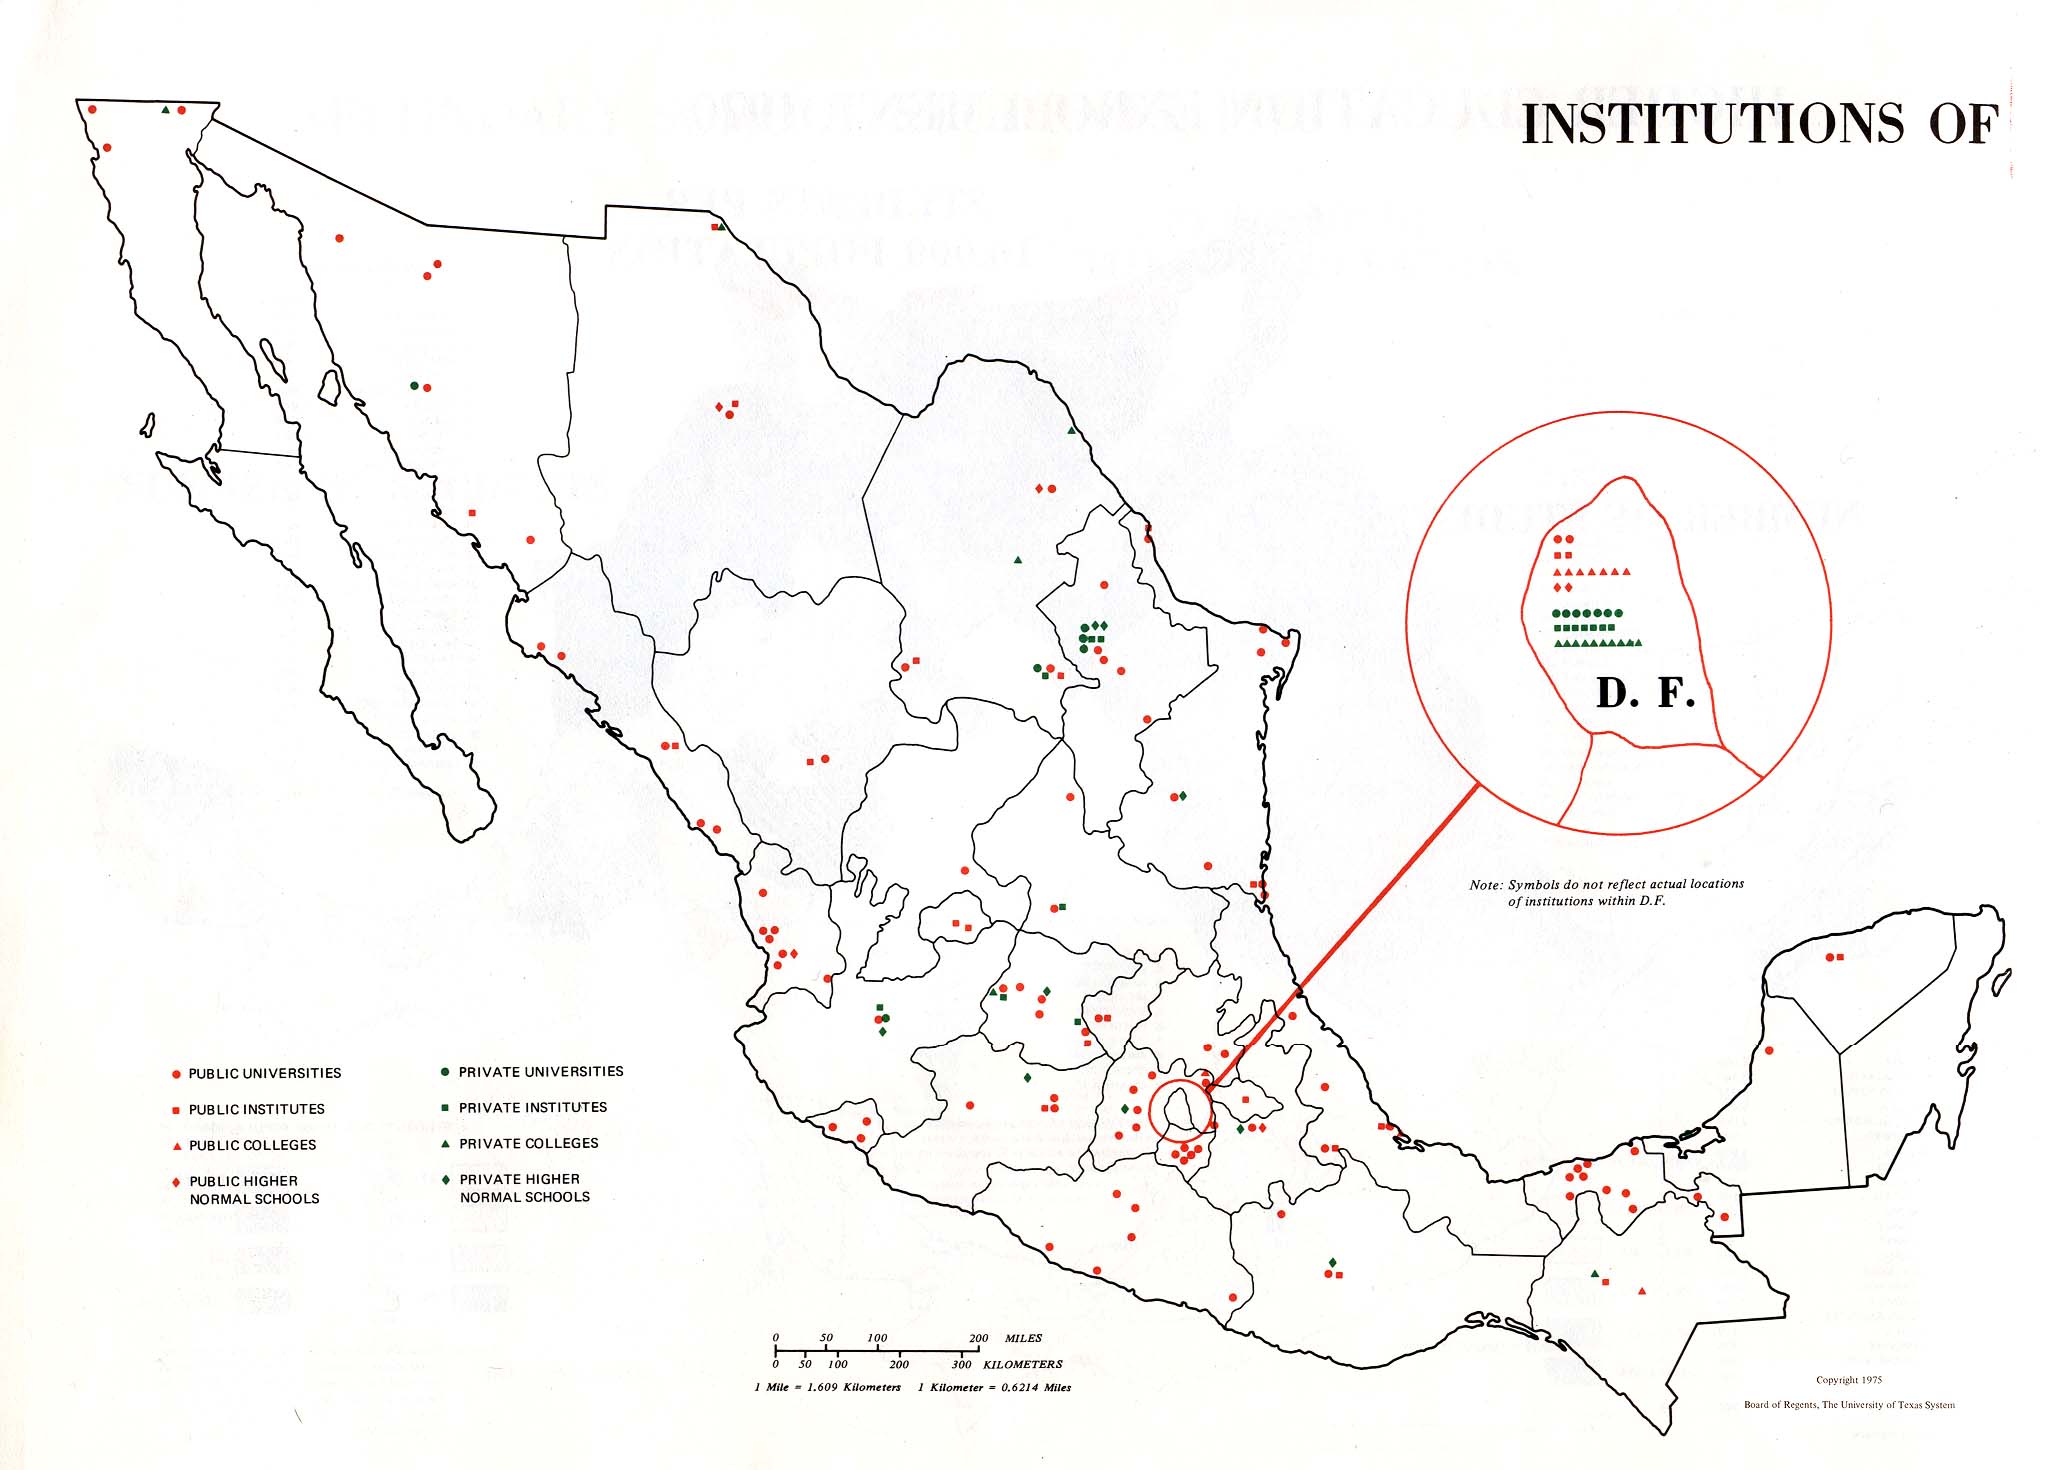
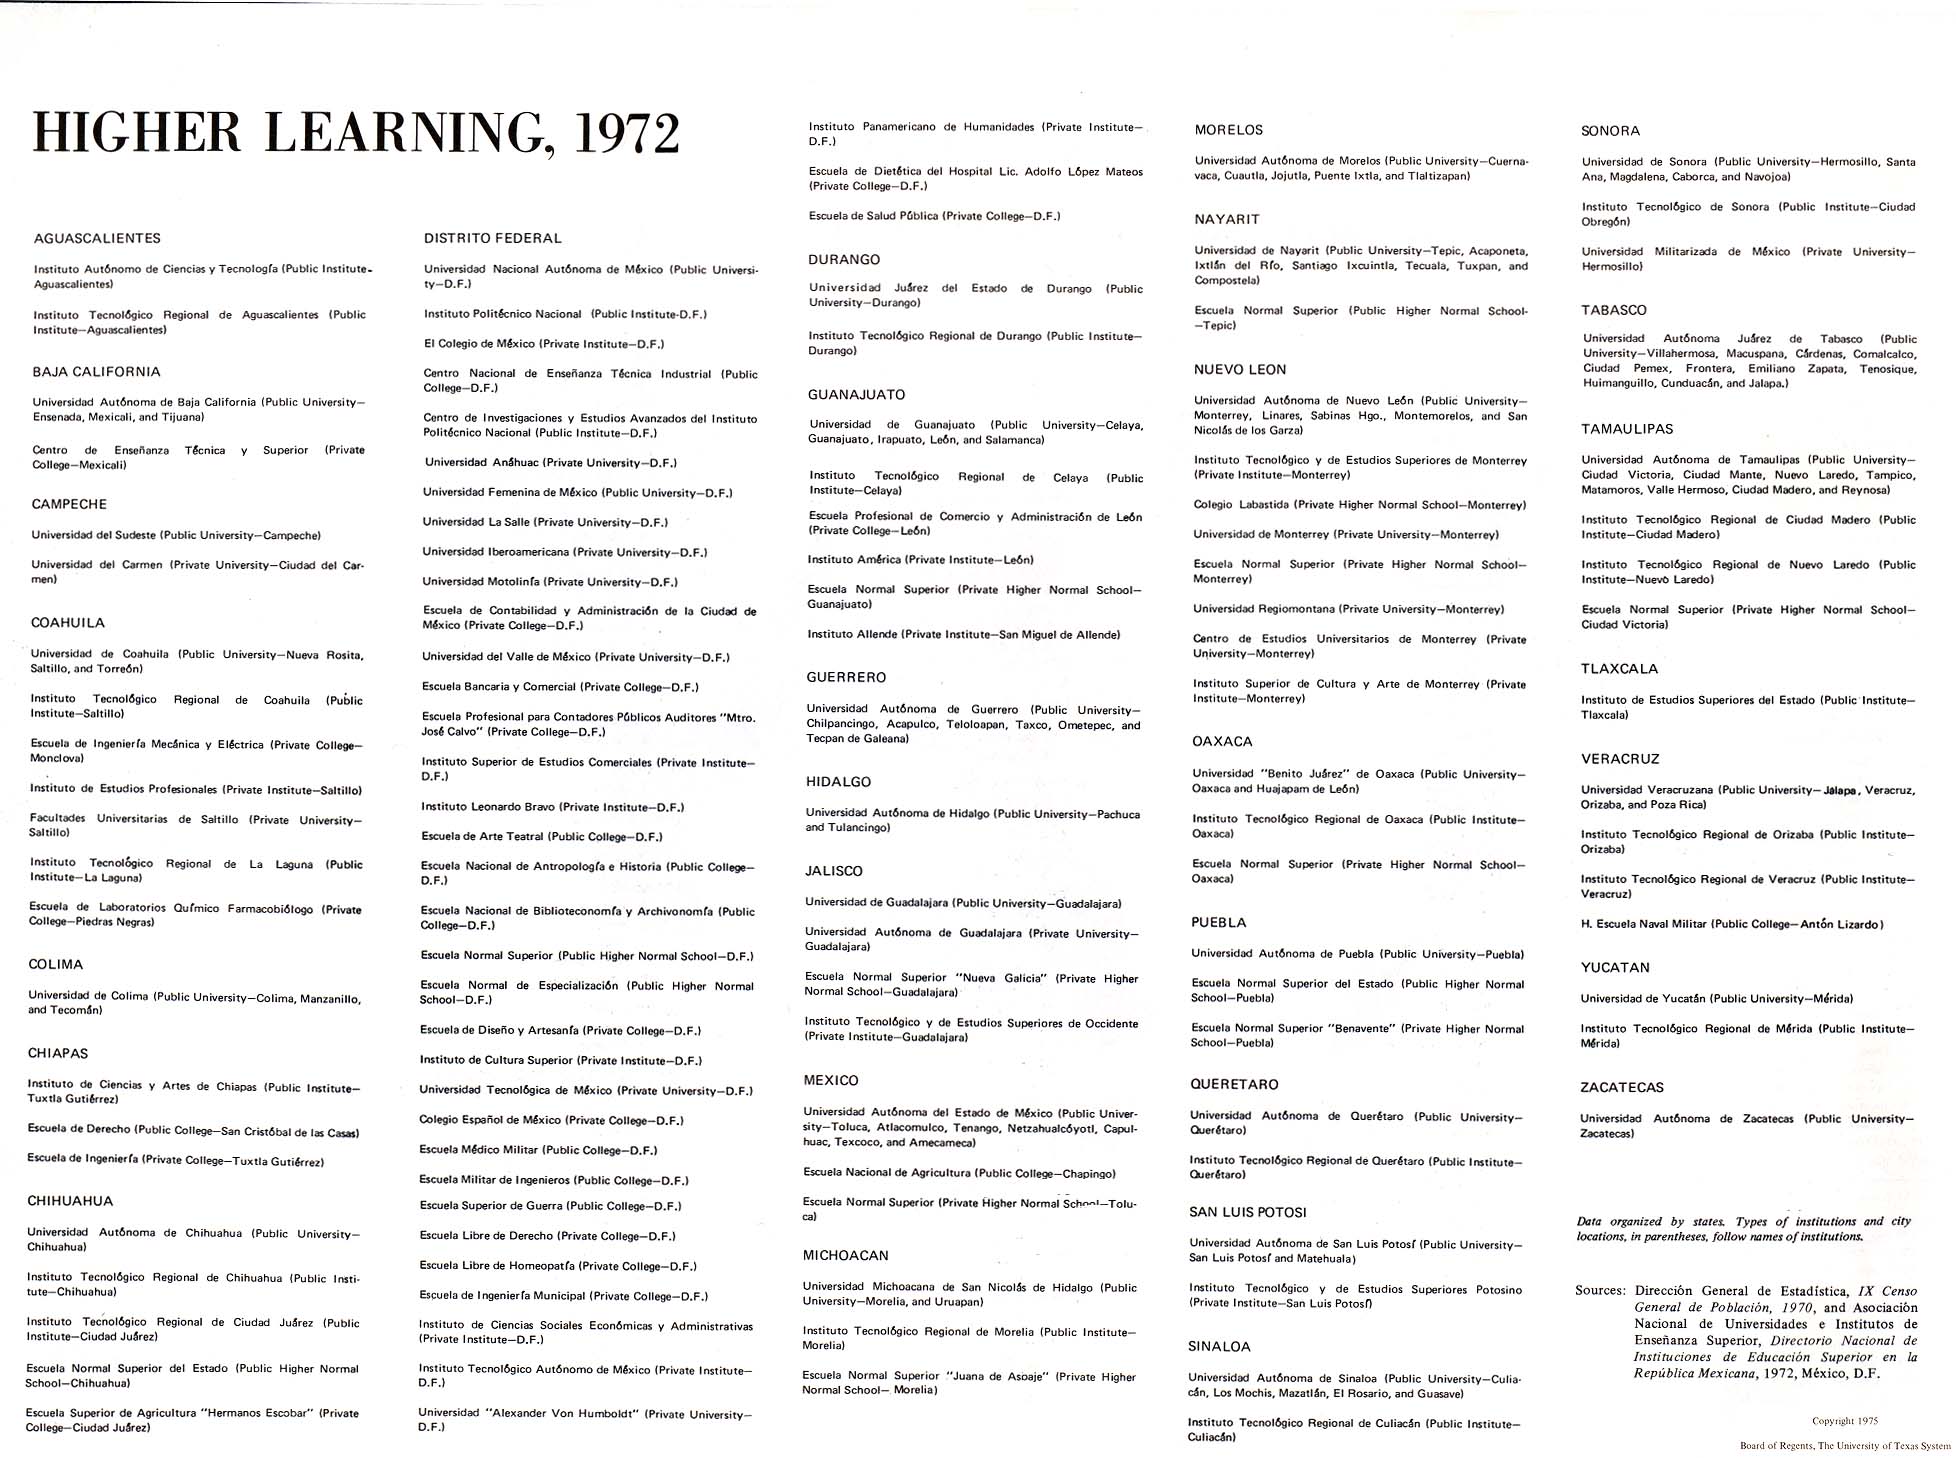
Institutions of Higher Learning, 1972 with Index (213K)
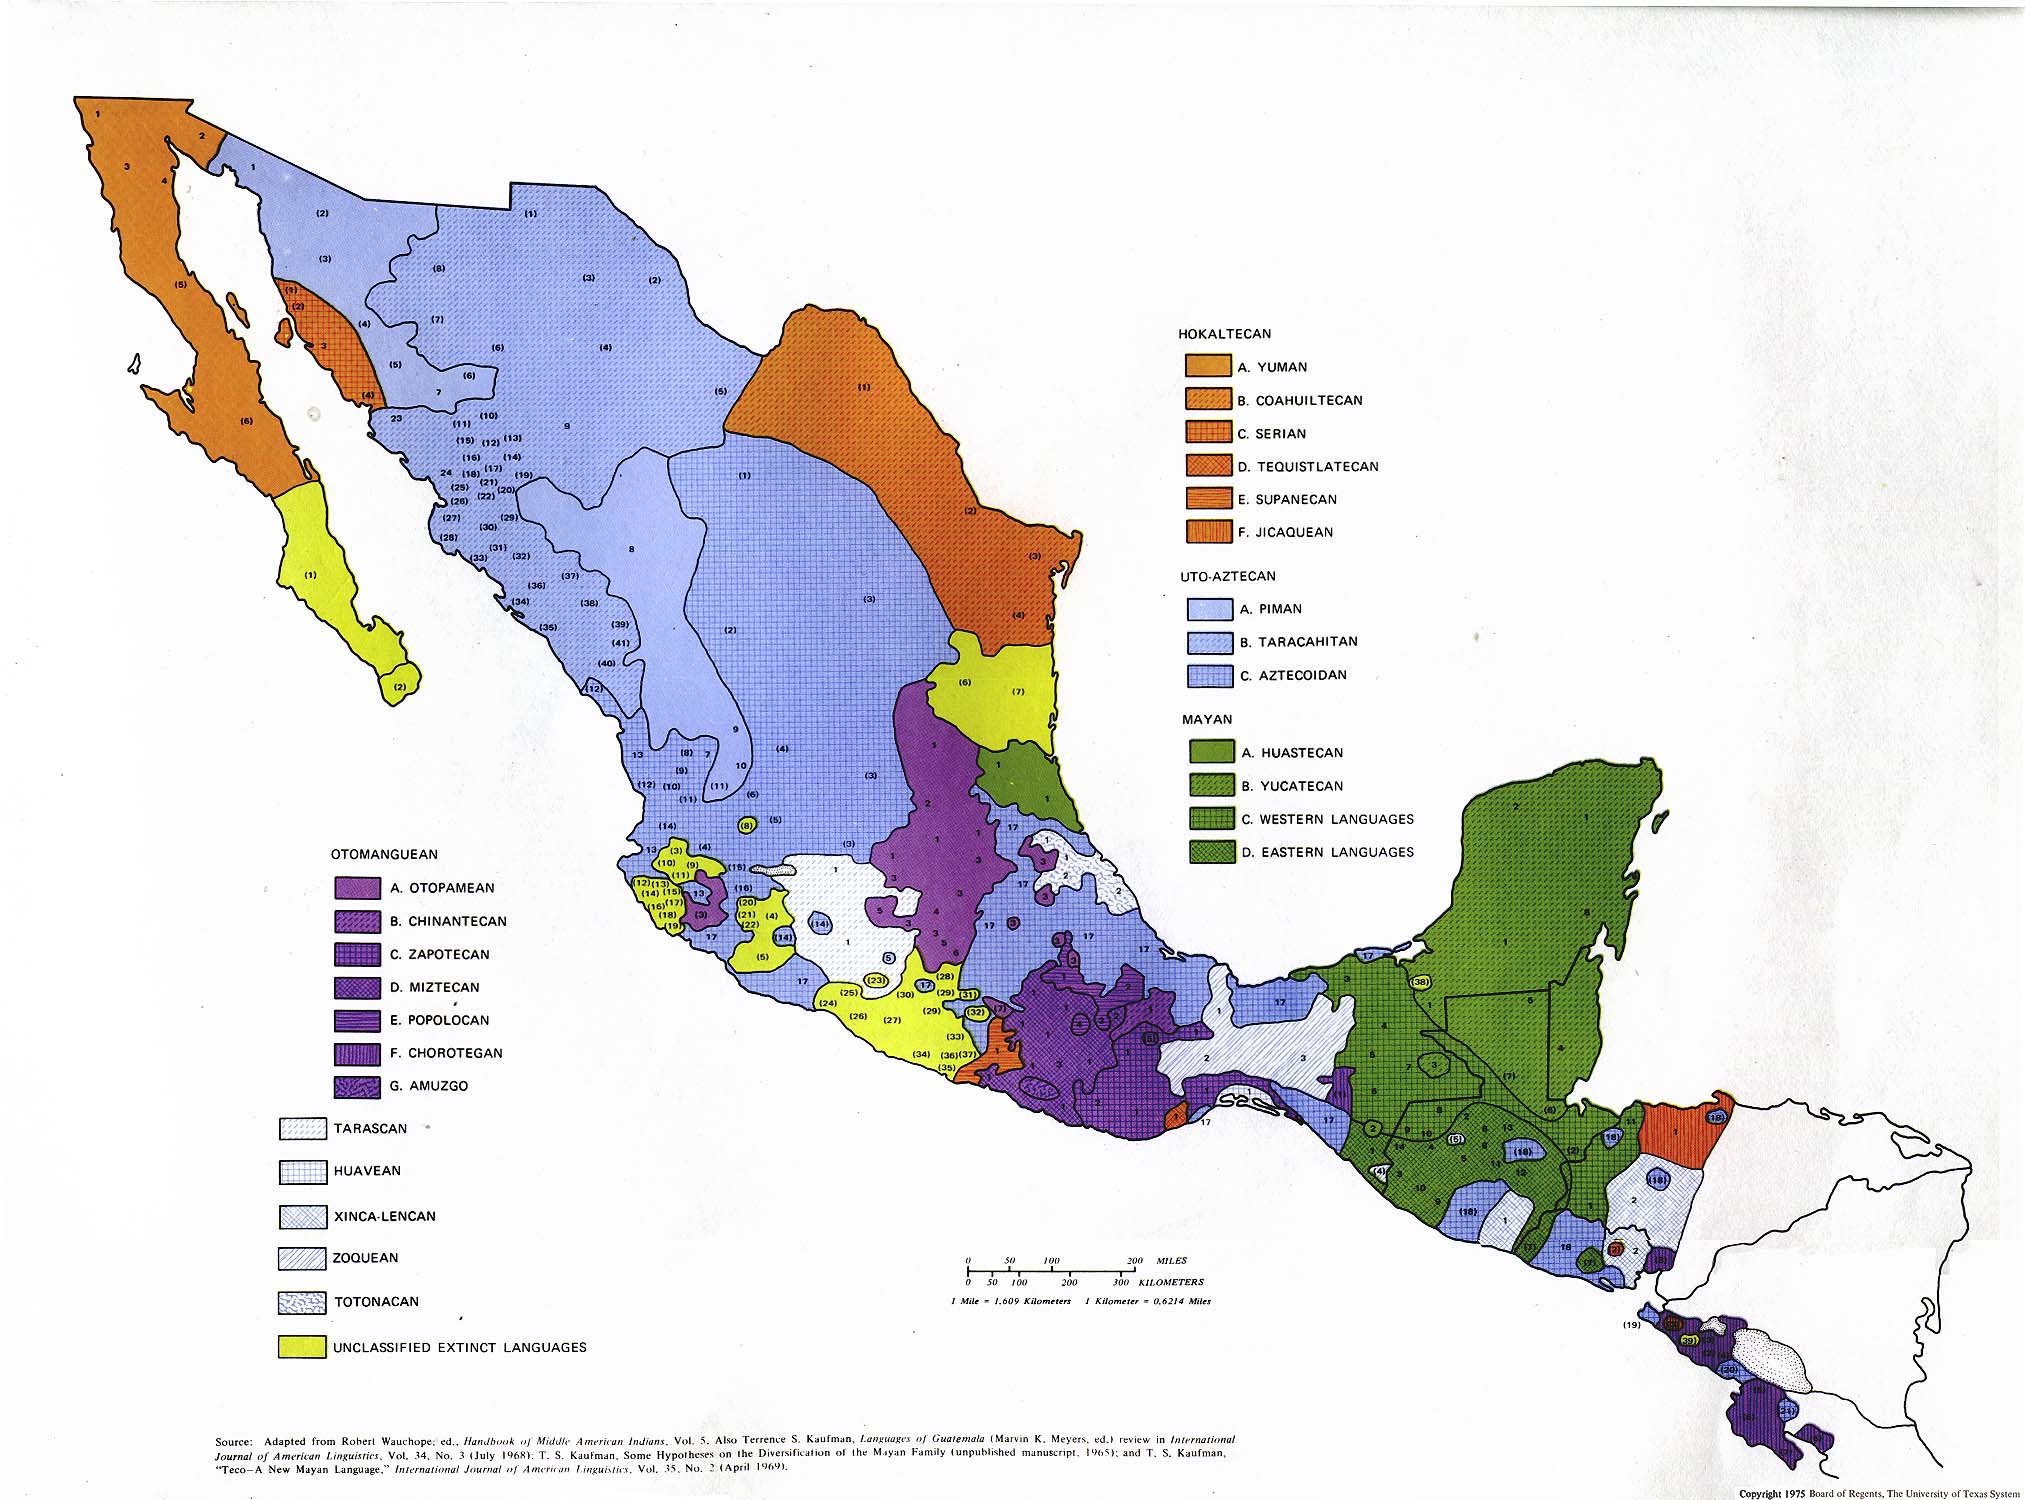
Aboriginal Languages: Mexico and Parts of Central America (319K) and Text Description (240K)
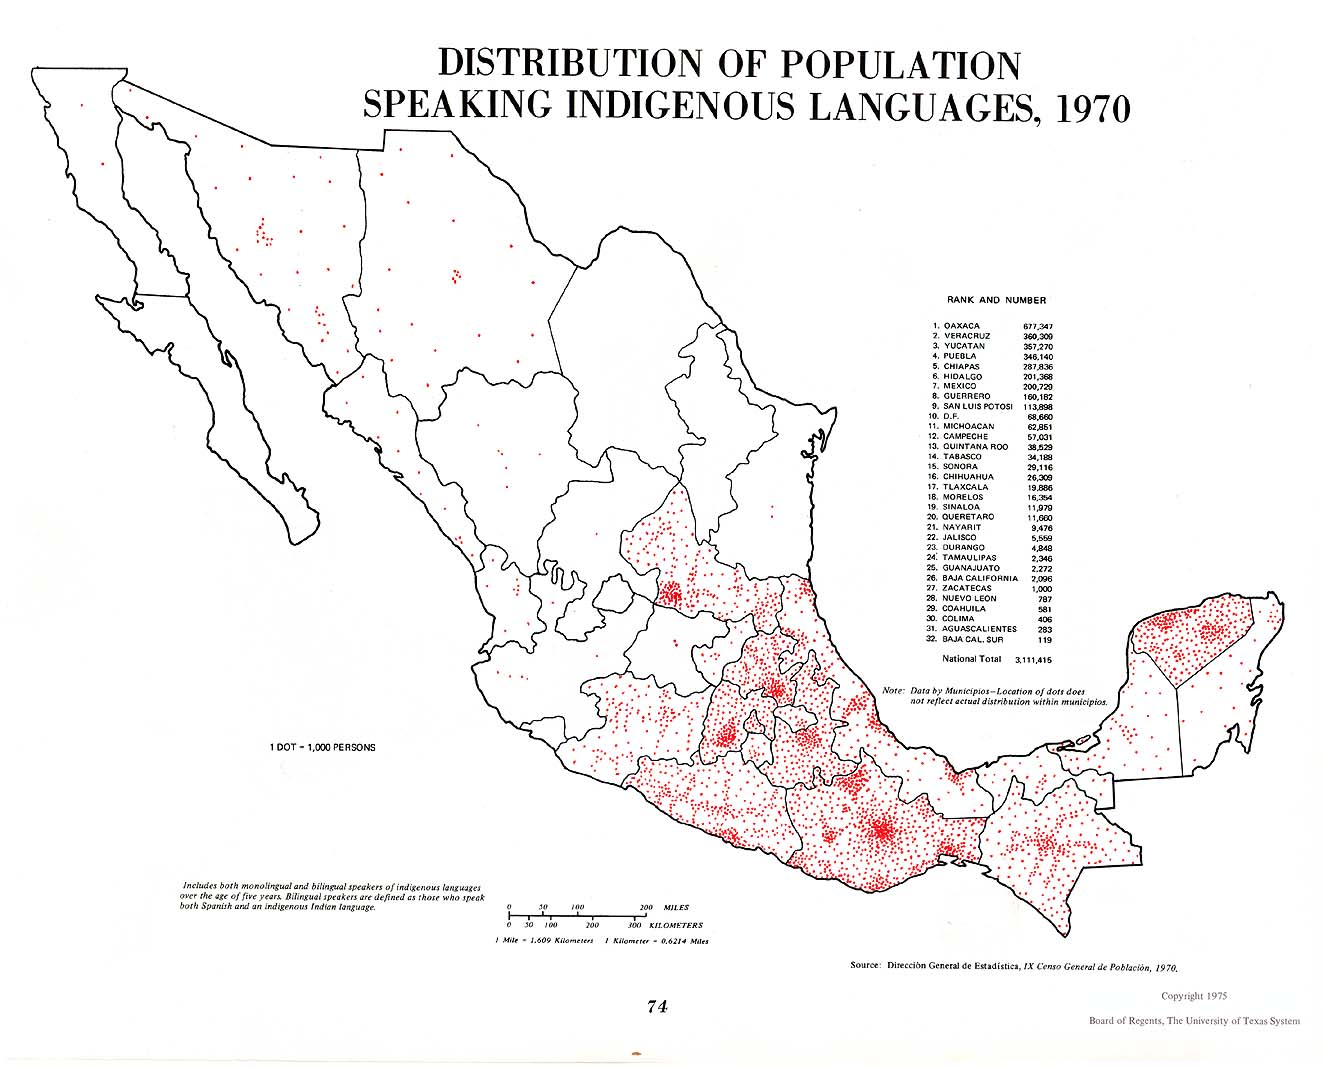
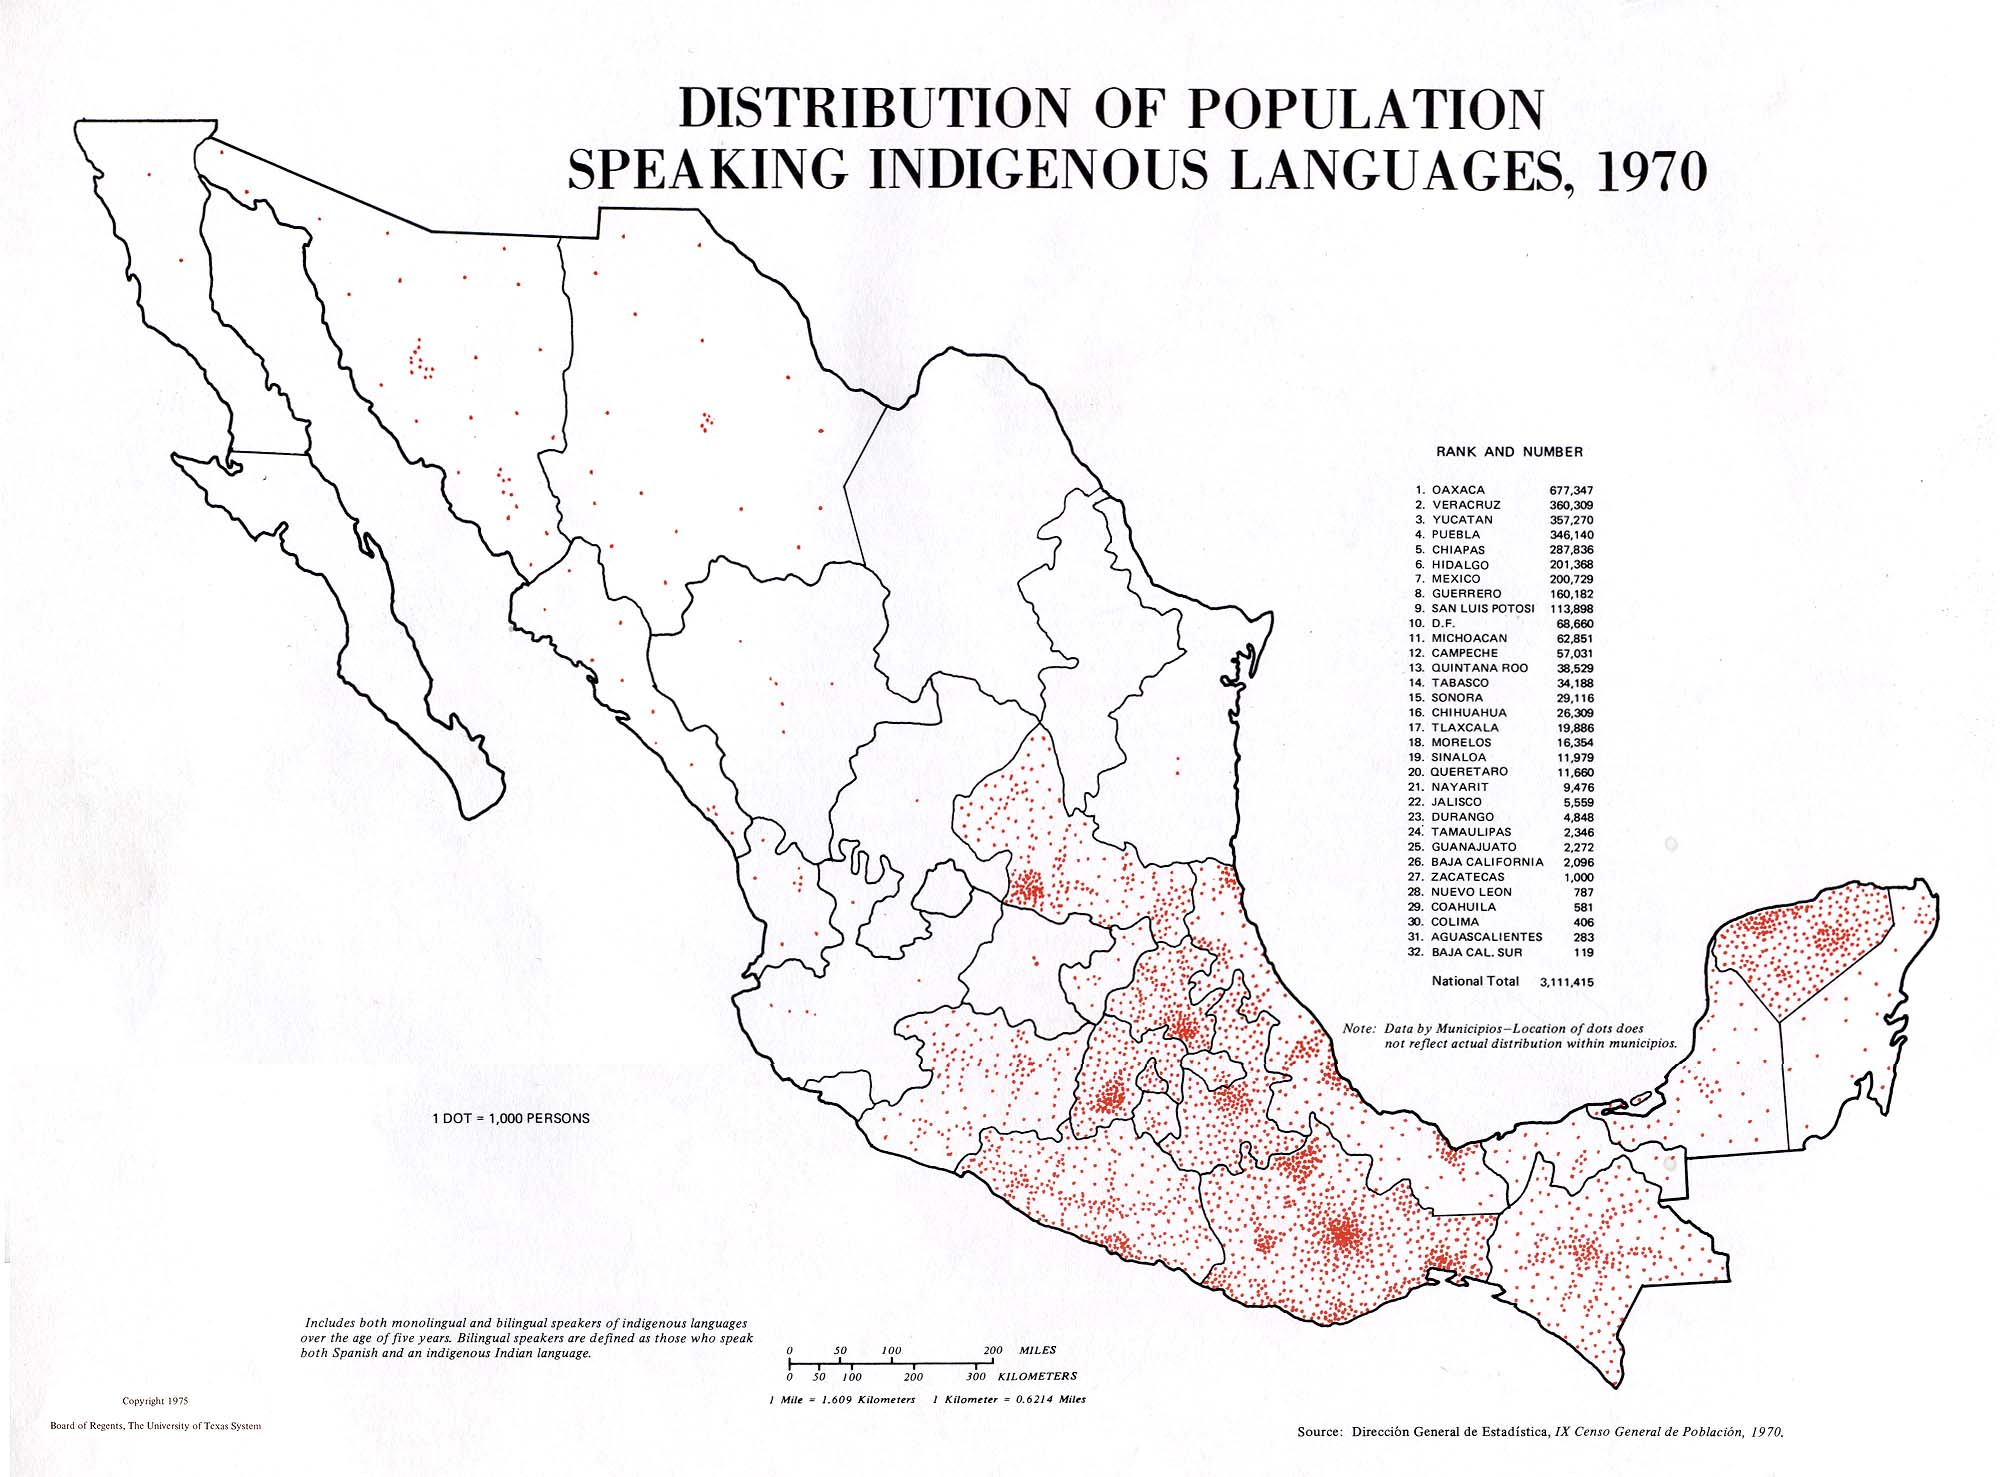
Distribution of Population Speaking Indigenous Languages, 1970 (276K)
Percent of Population Speaking Indigenous Languages: 1940; 1970 (276K)
Monolingual Speakers of Indigenous Languages: 1940; 1970 (510K)
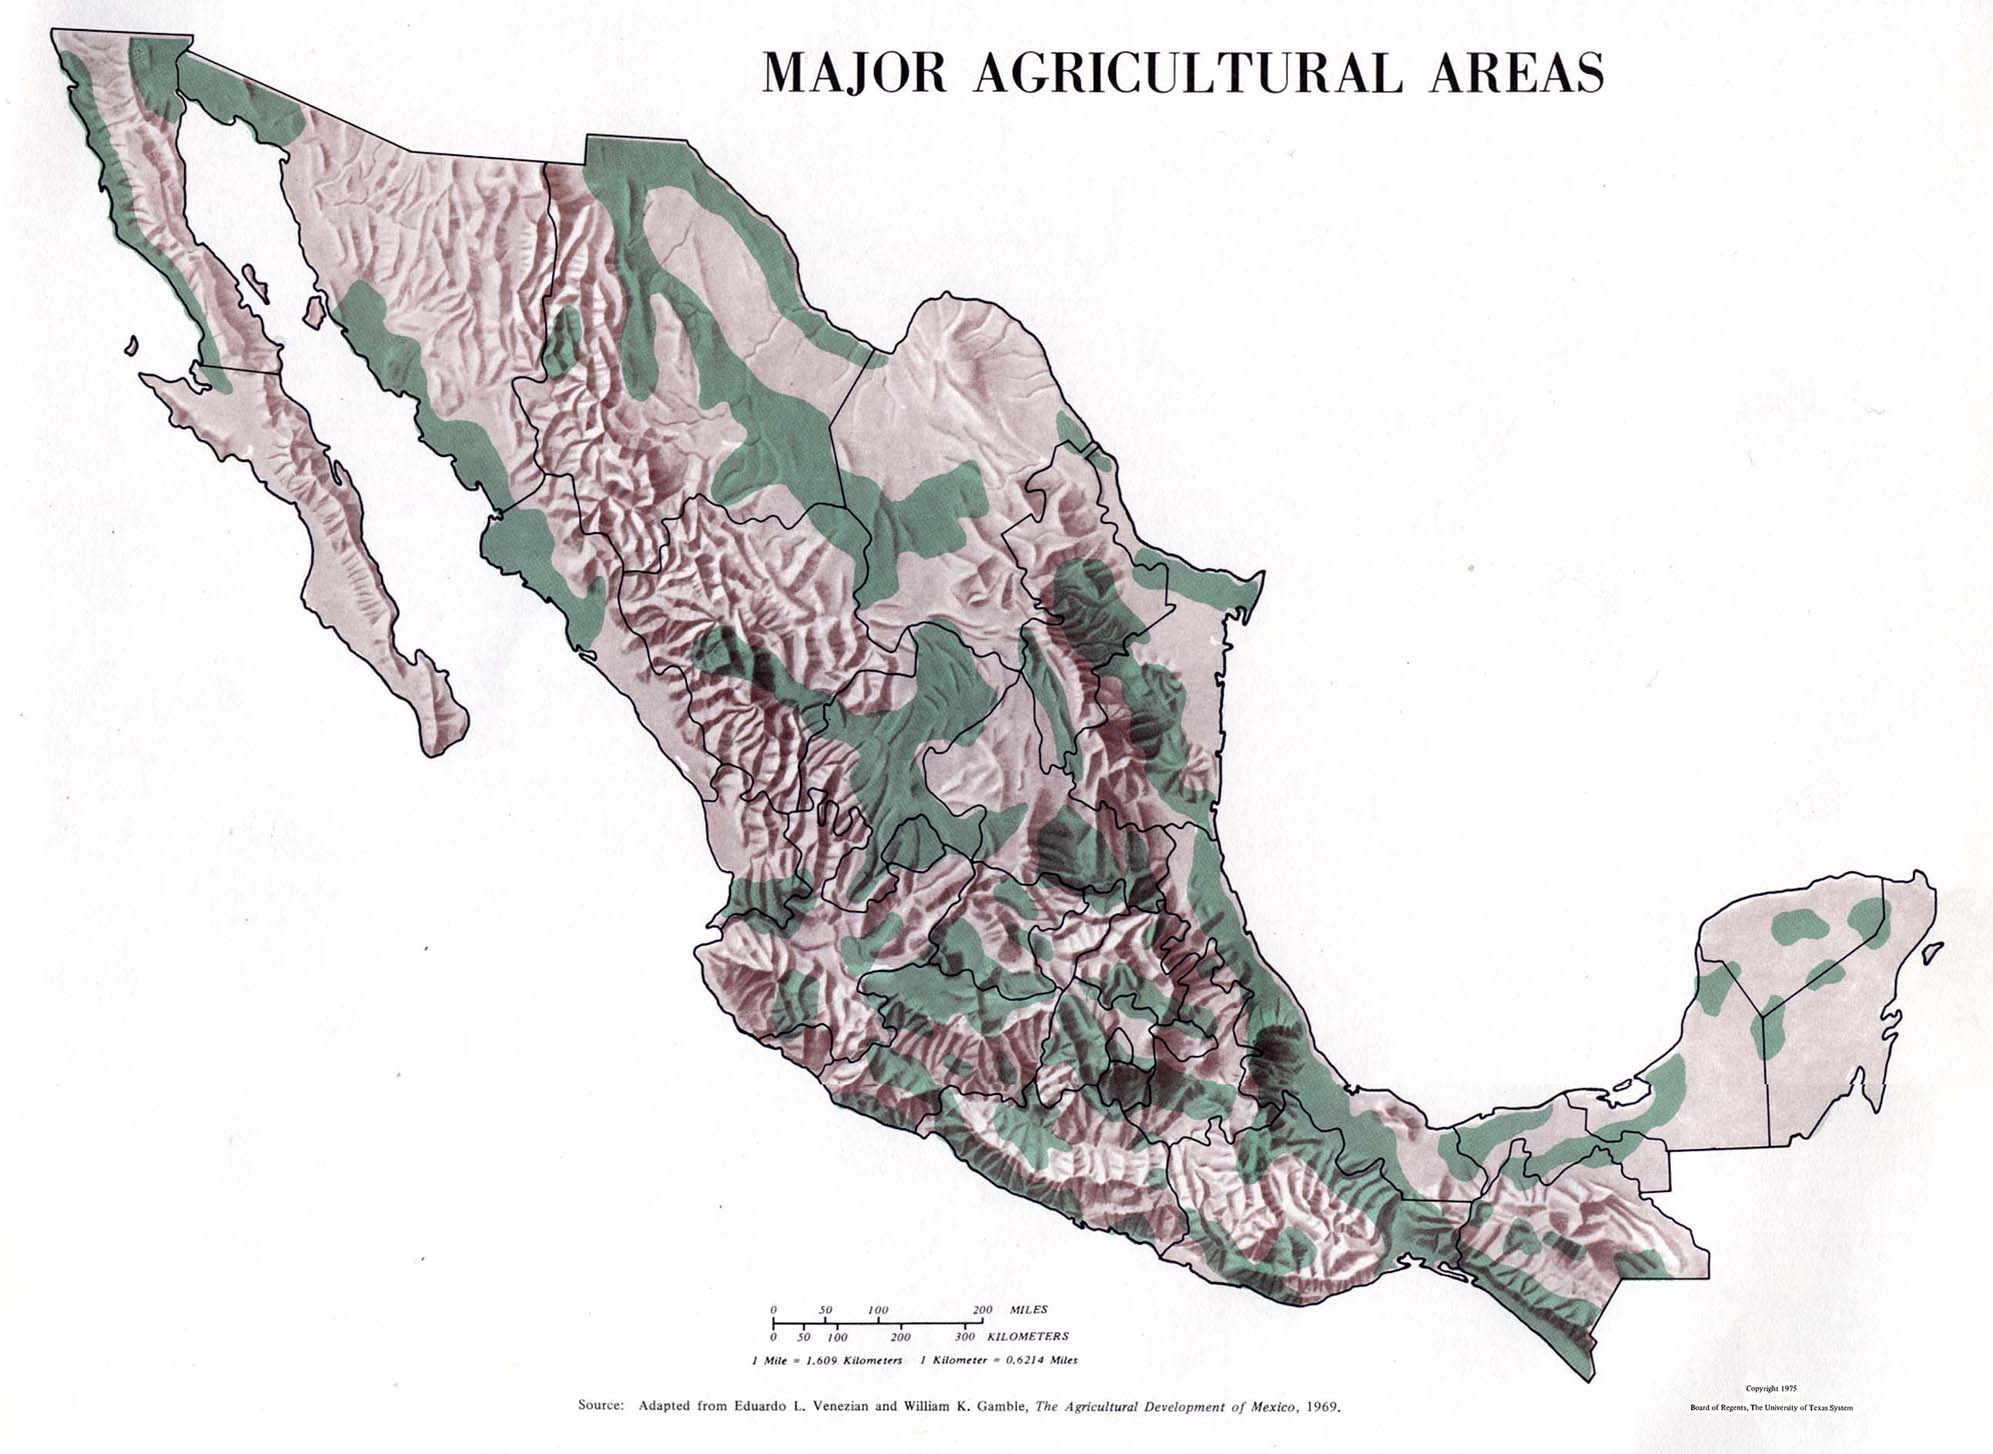
Major Agricultural Areas (208K)
Agriculture, 1970-71: Number of Hectares; Production (276K)
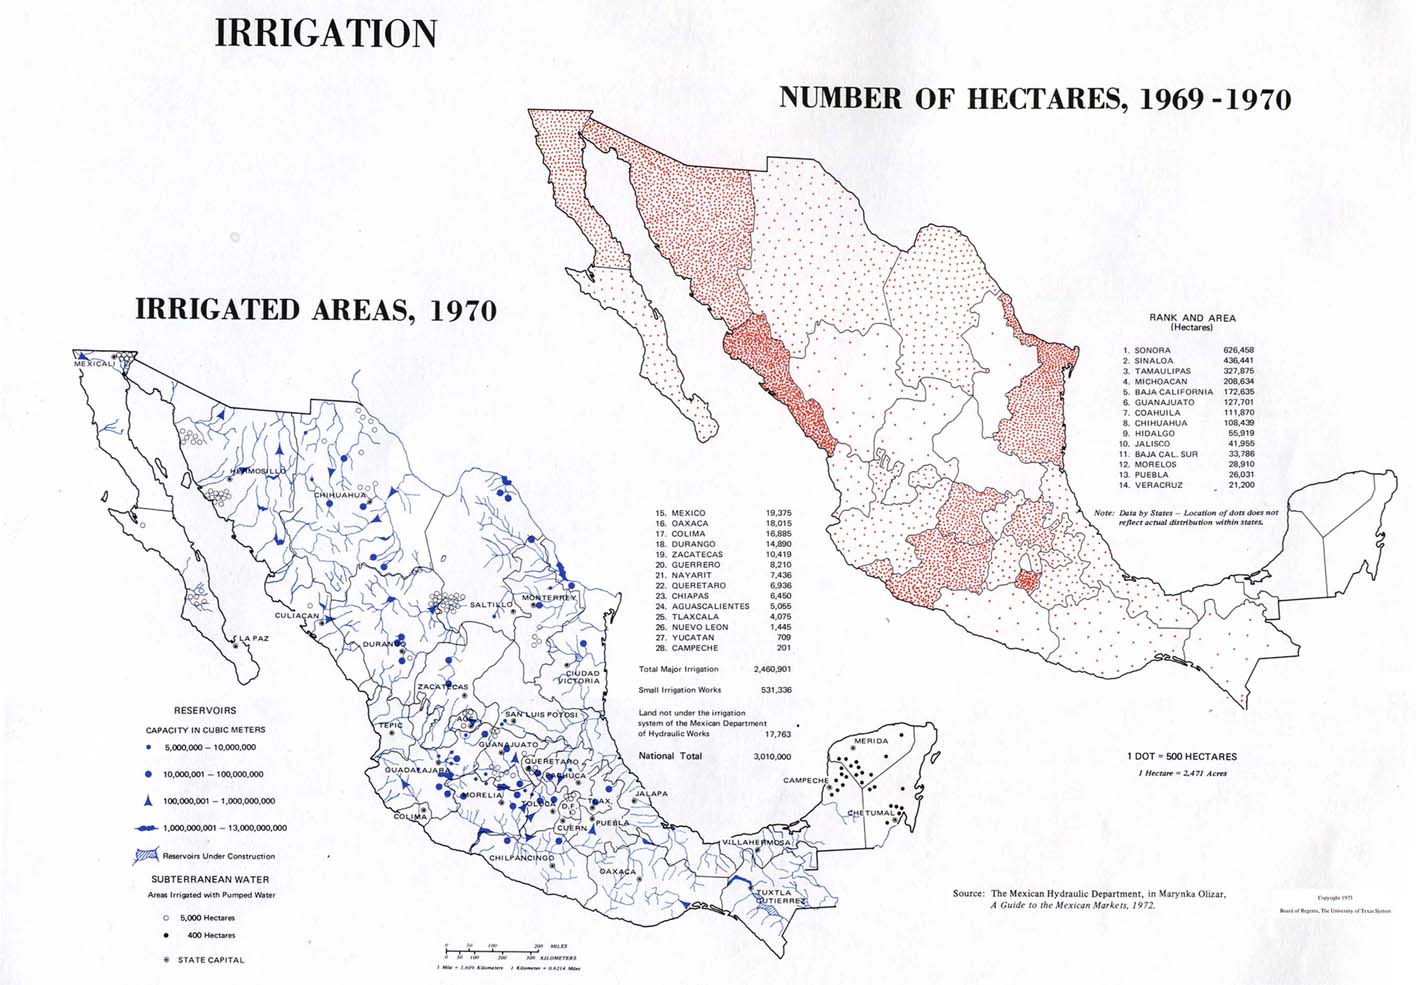
Irrigation: Irrigated Areas, 1970: Number of Hectares, 1969-1970 (180K)
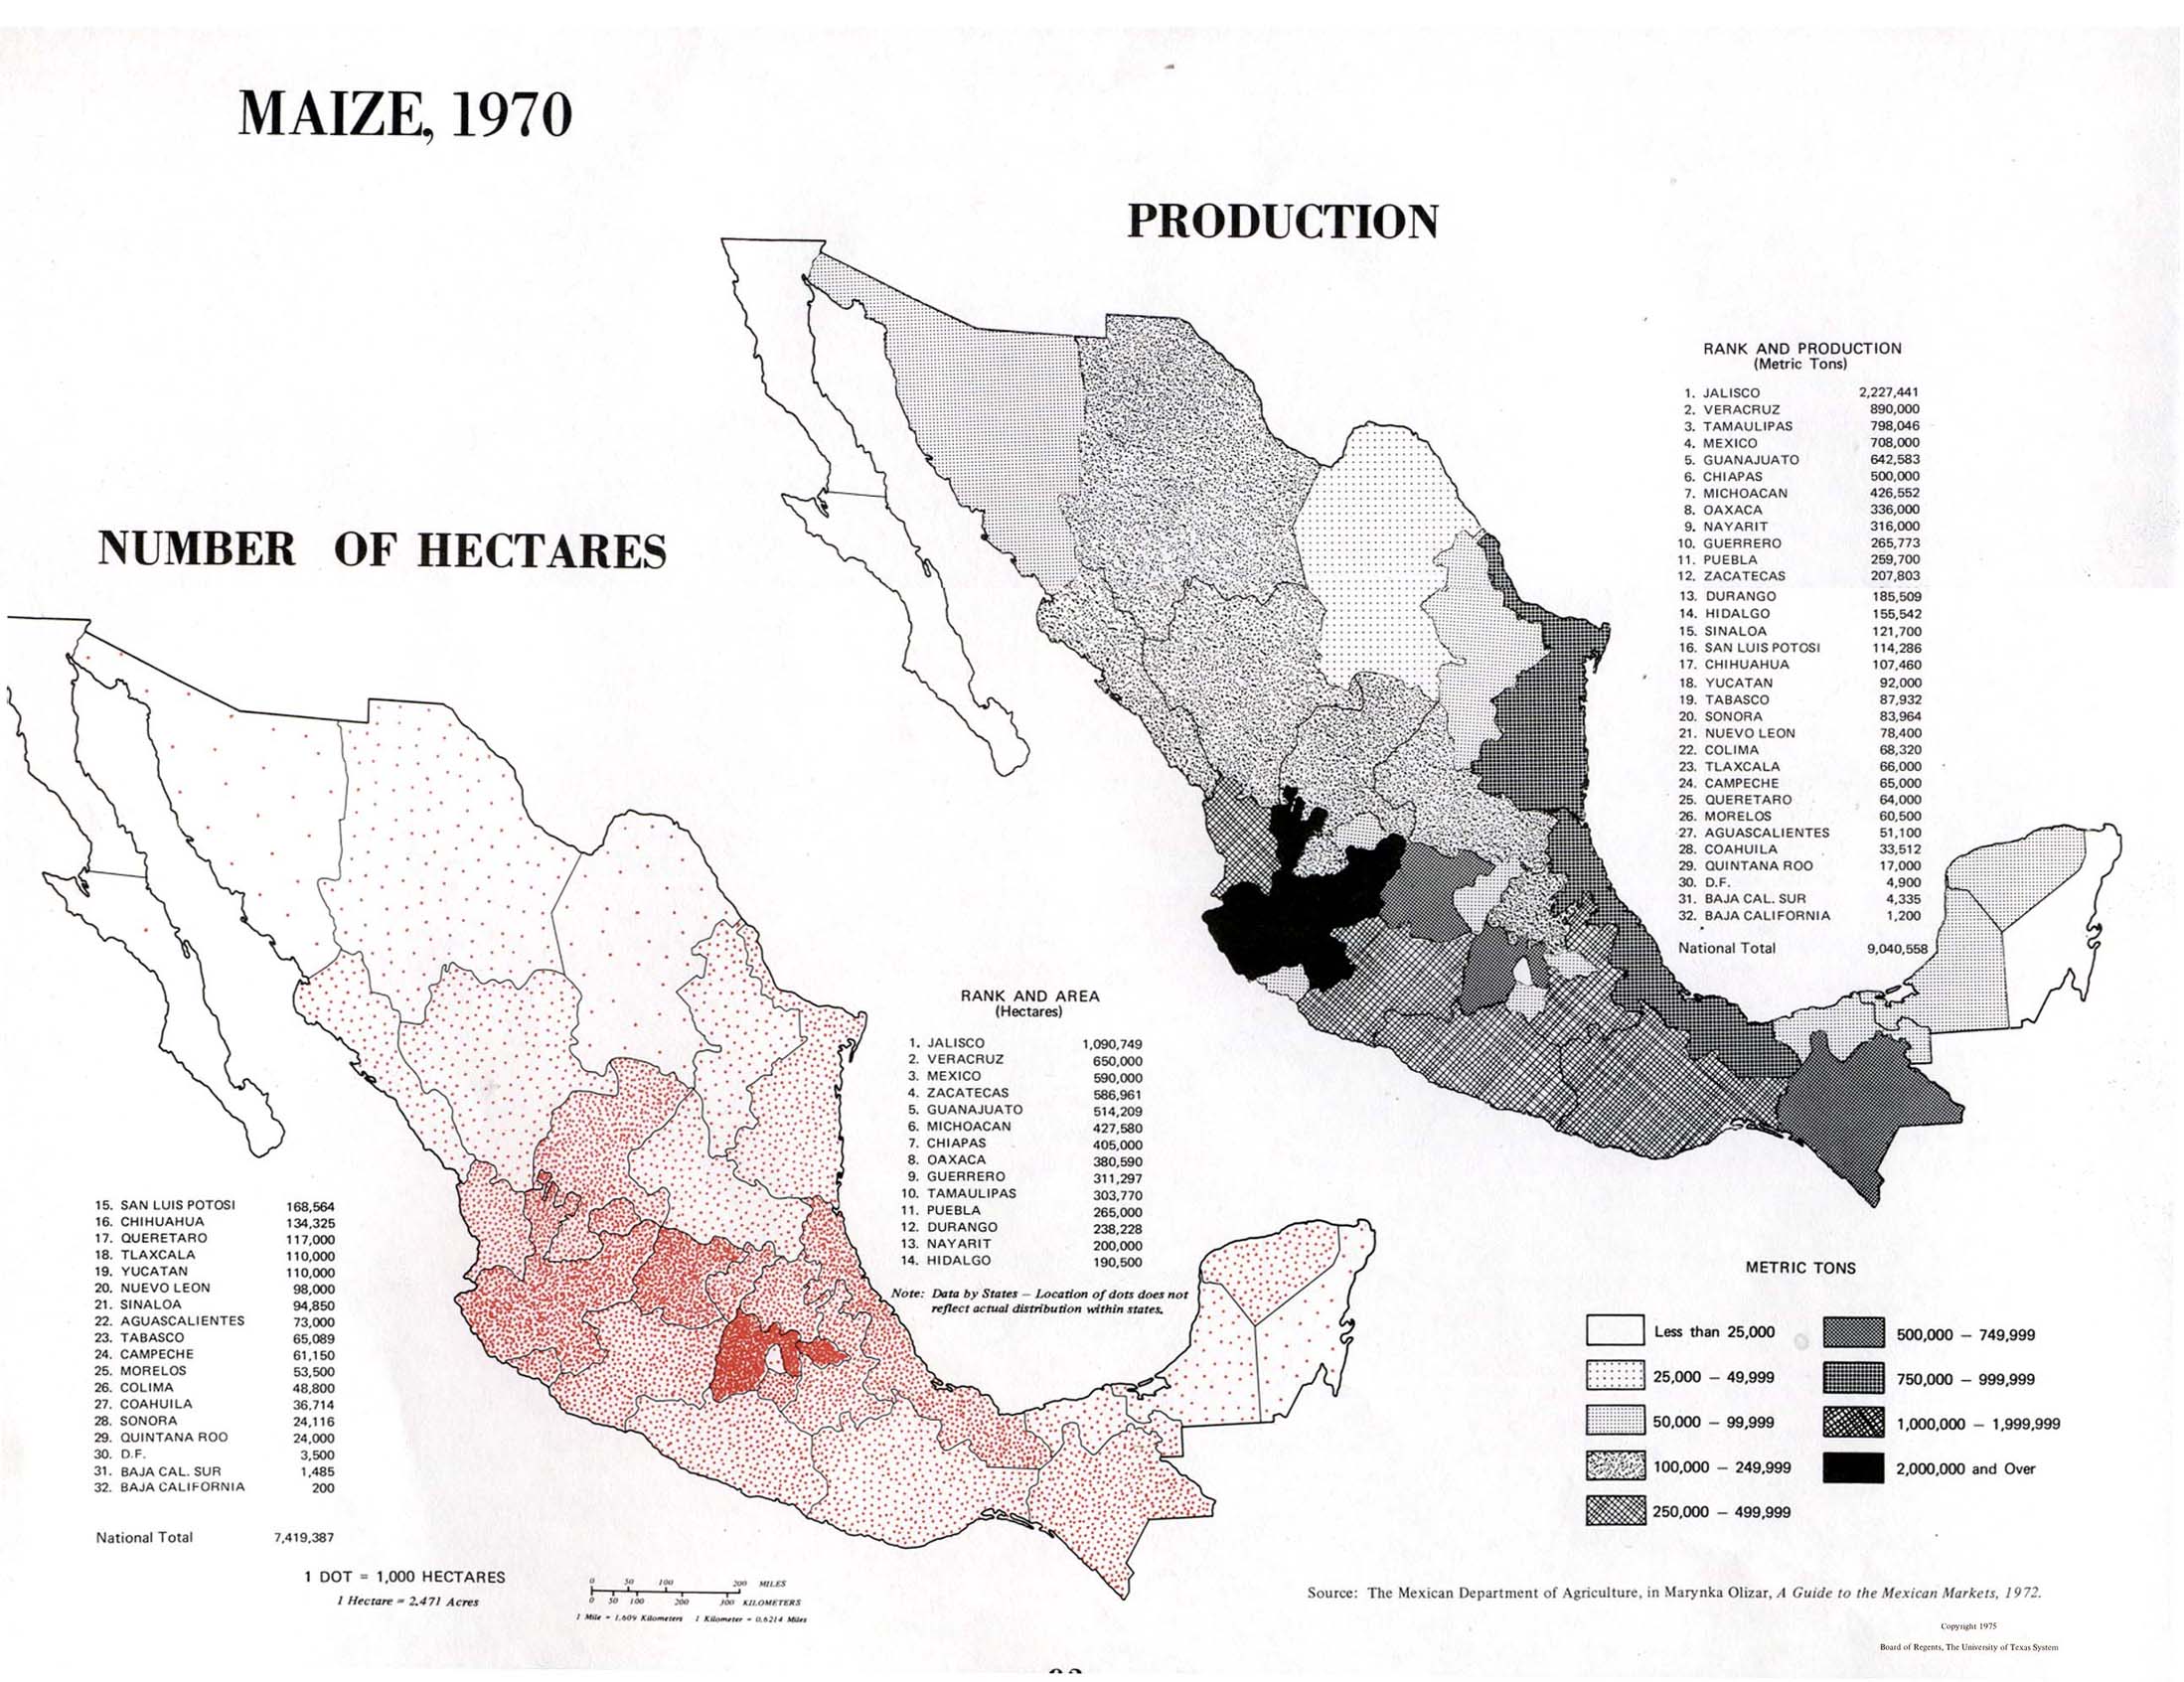
Maize, 1970: Number of Hectares; Production (446K)
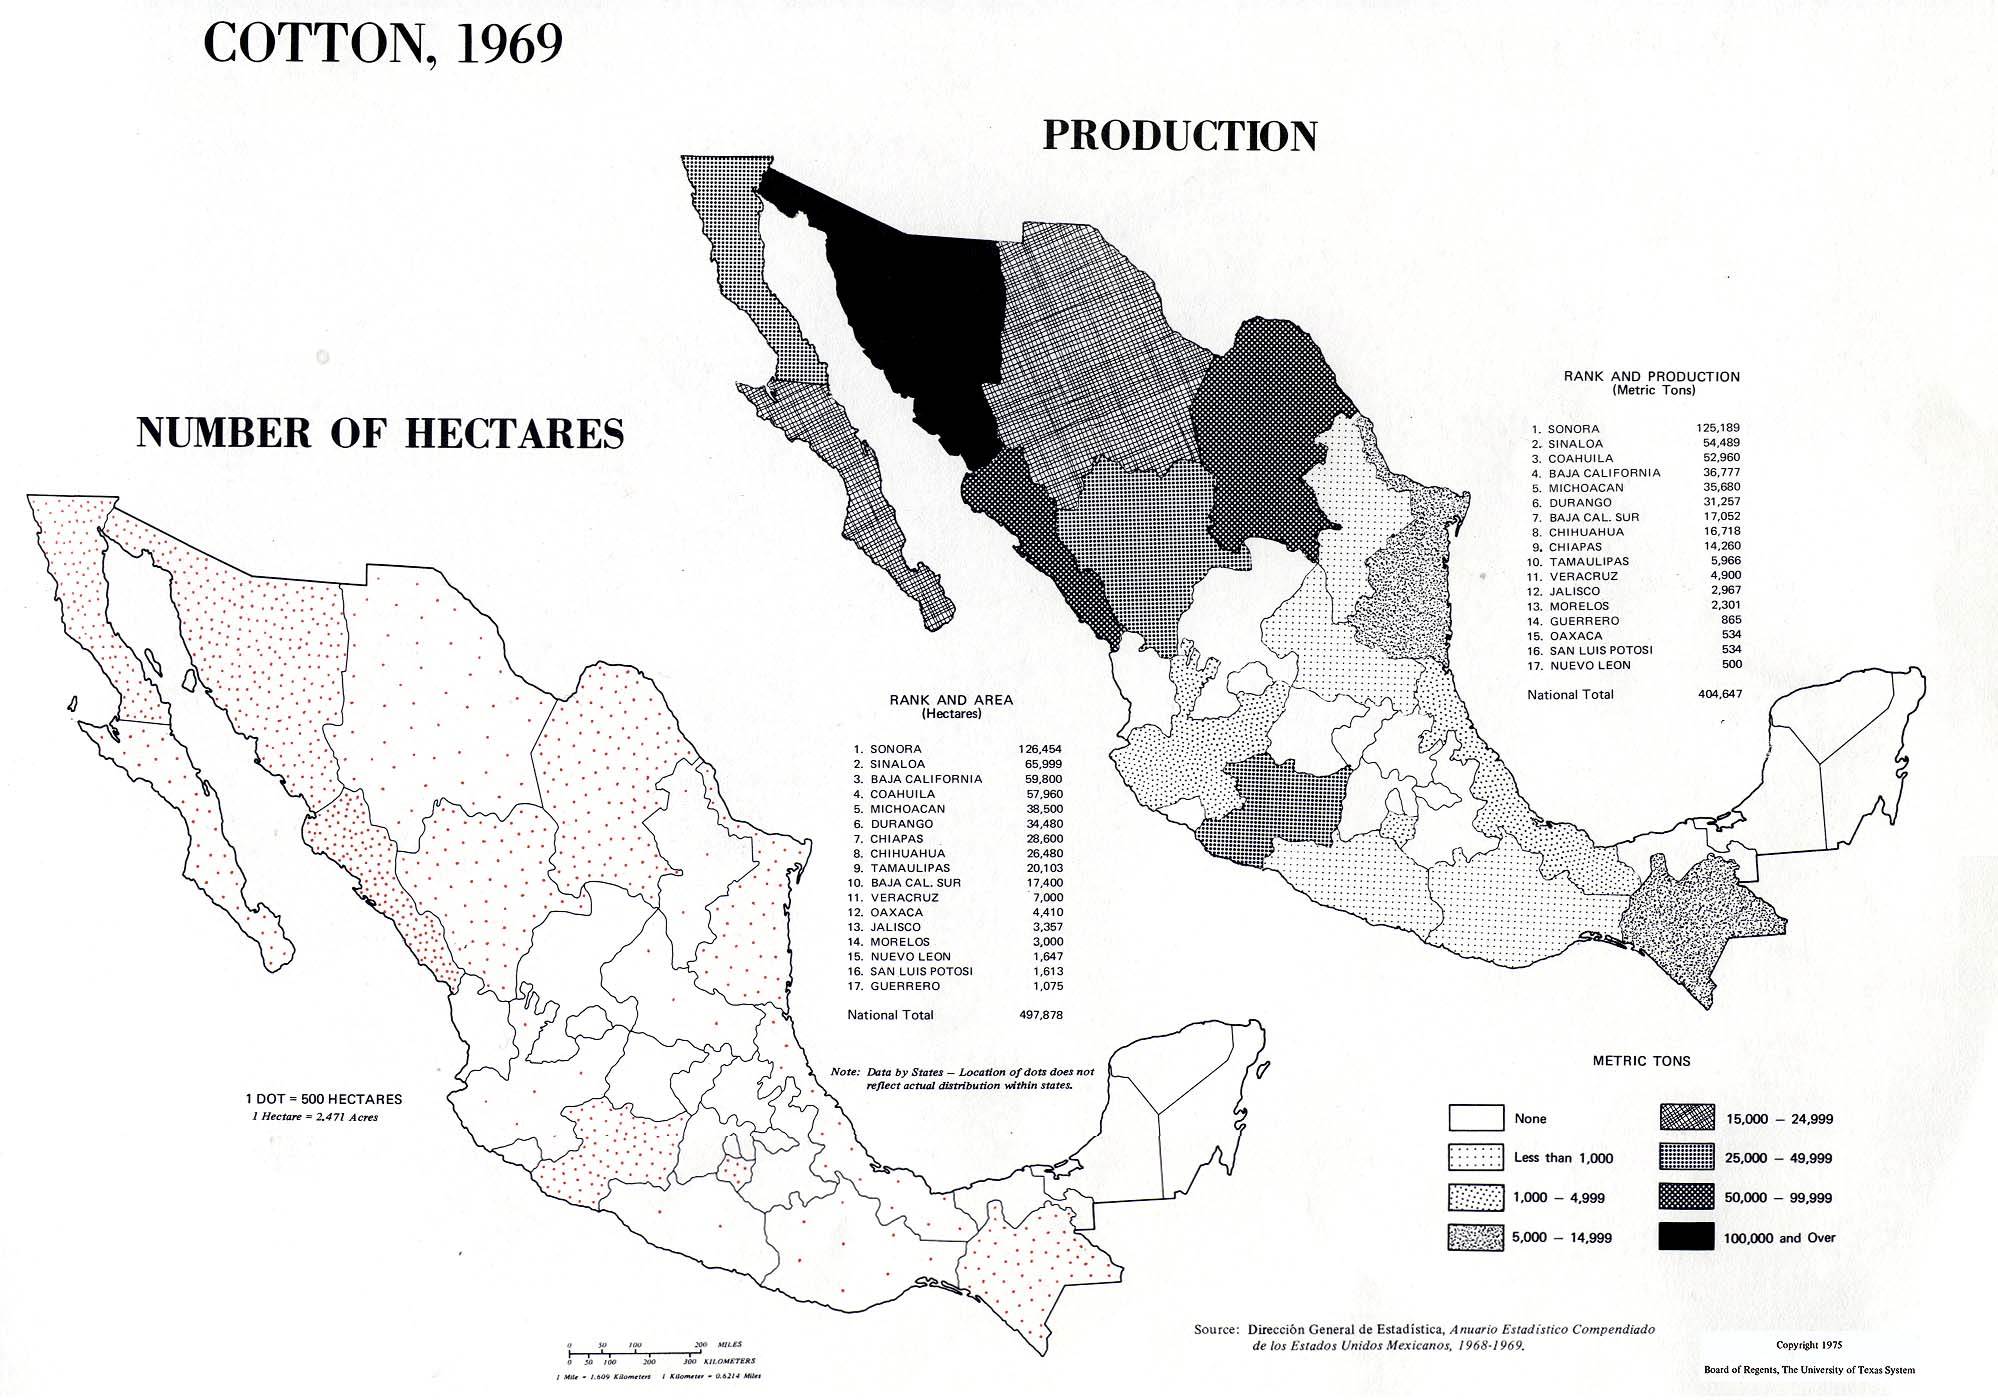
Cotton, 1969: Number of Hectares; Production (364K)
Wheat, 1970: Number of Hectares; Production (347K)
Beans, 1970: Number of Hectares; Production (405K)
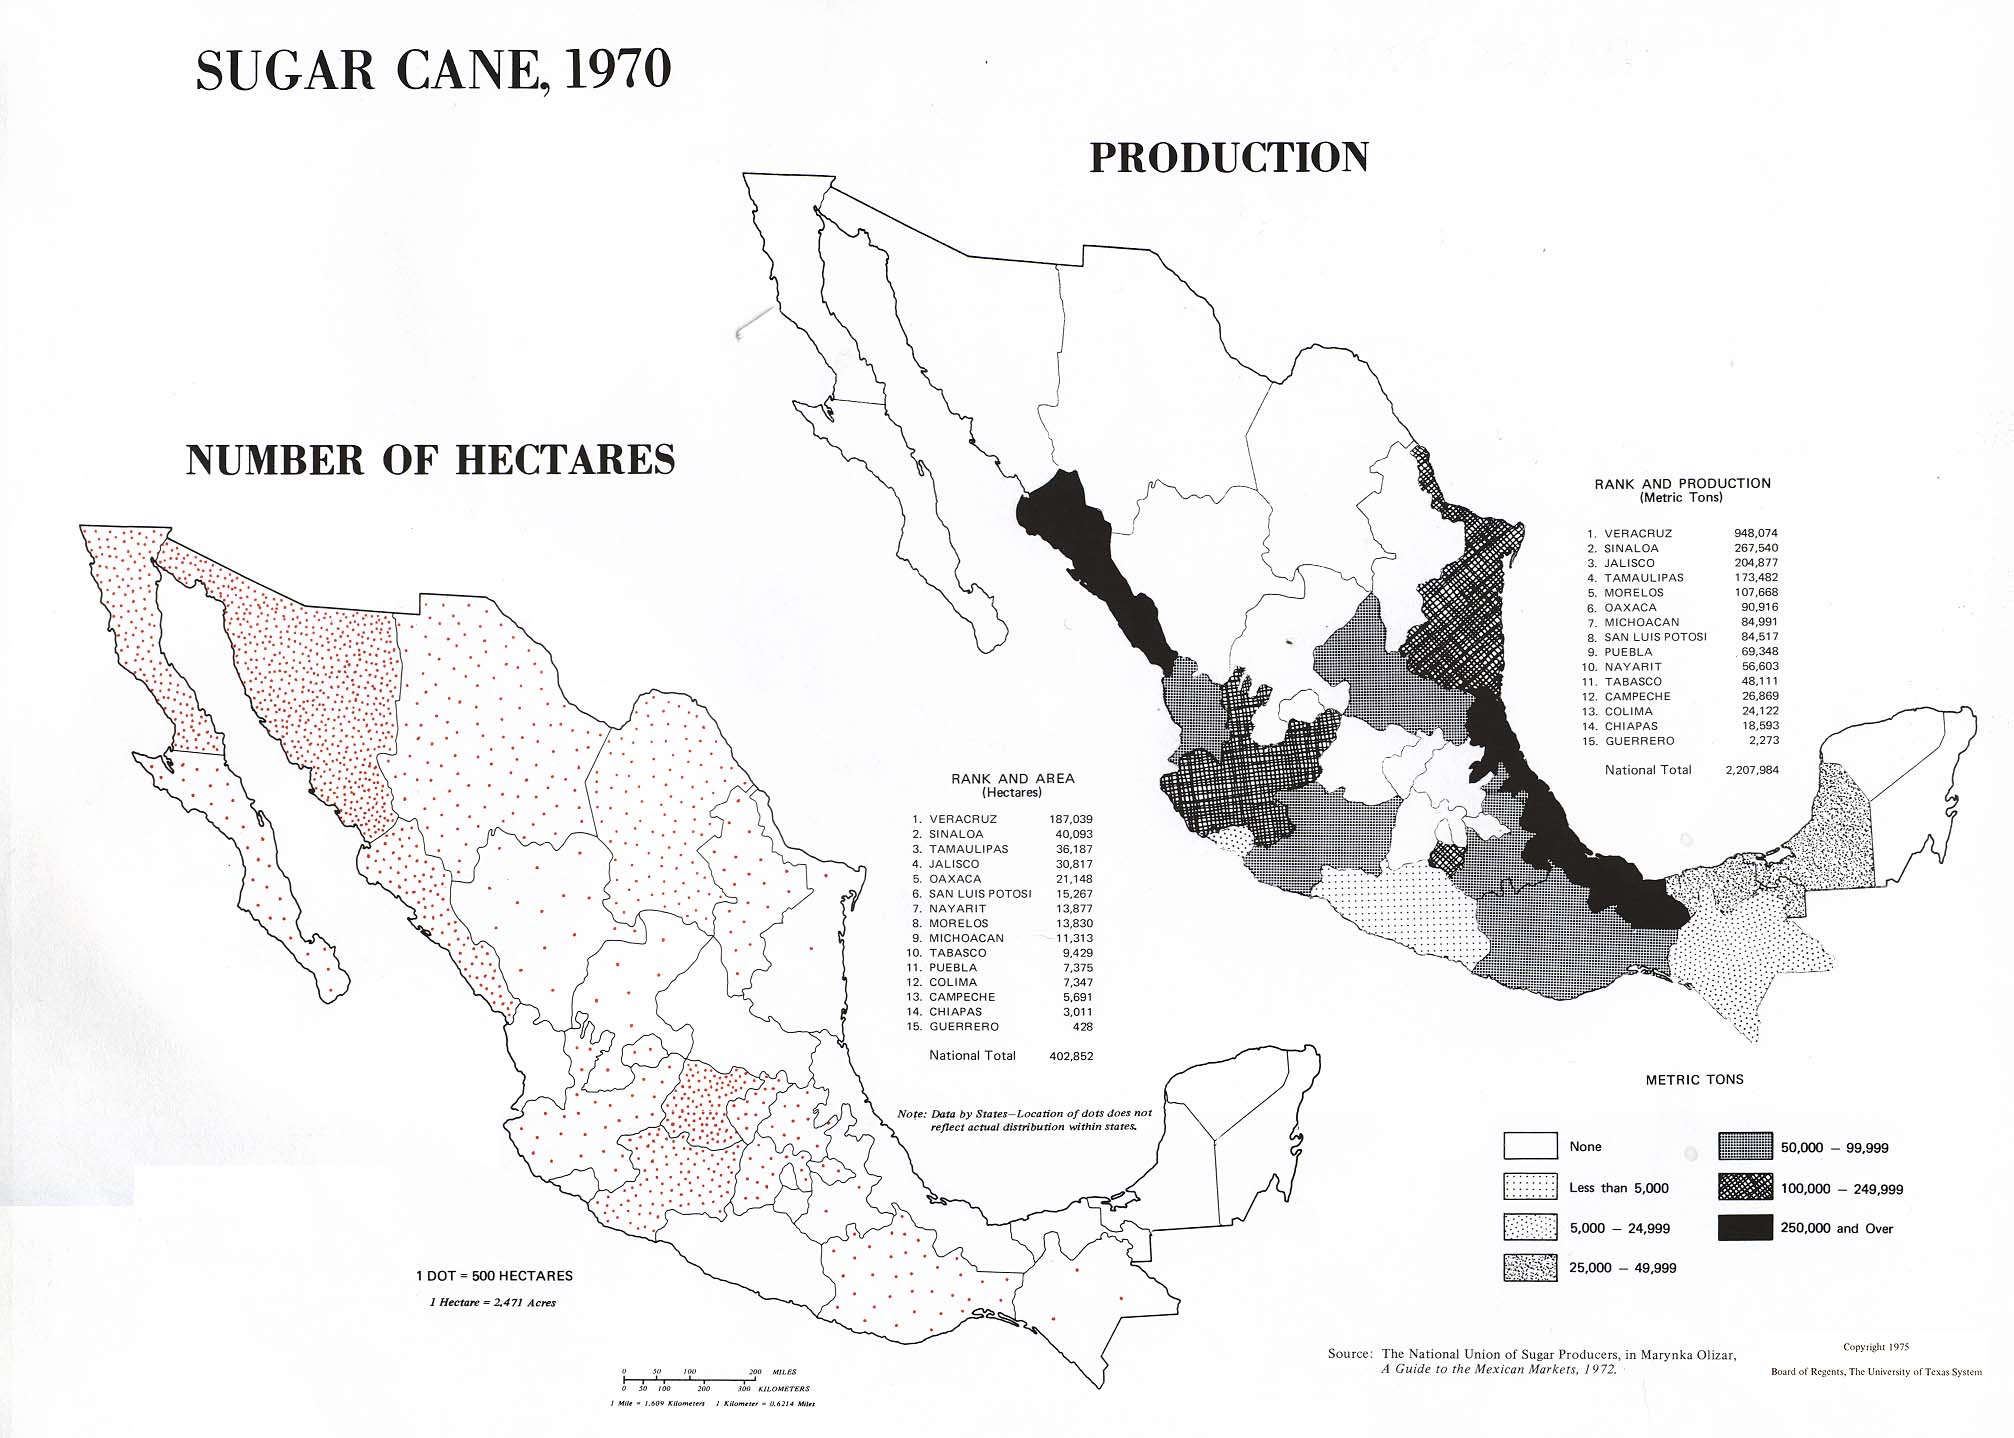
Sugar Cane, 1970: Number of Hectares; Production (291K)
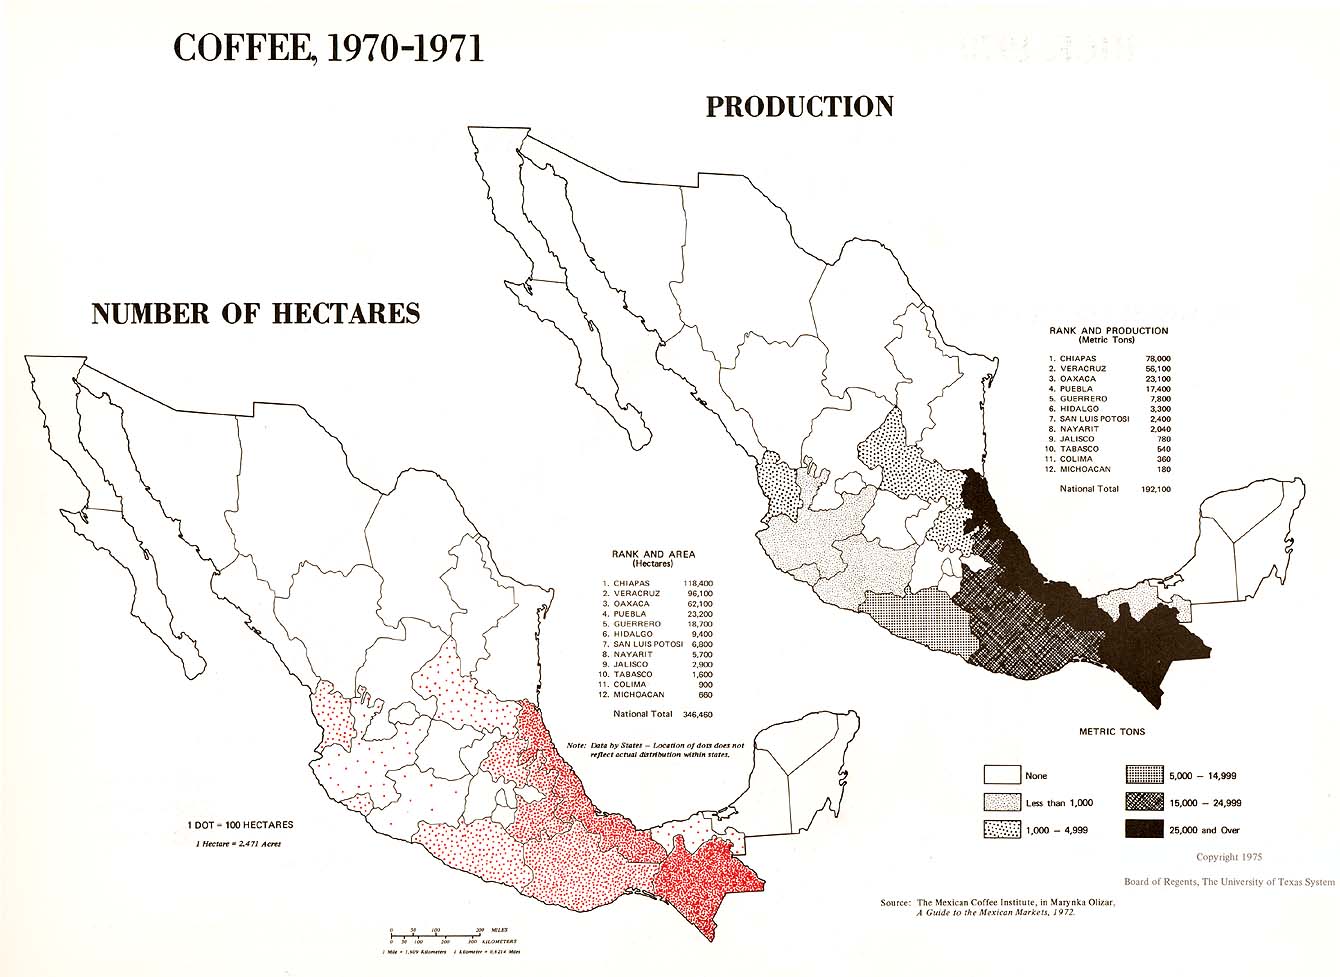
Coffee, 1970-1971: Number of Hectares; Production (171K)
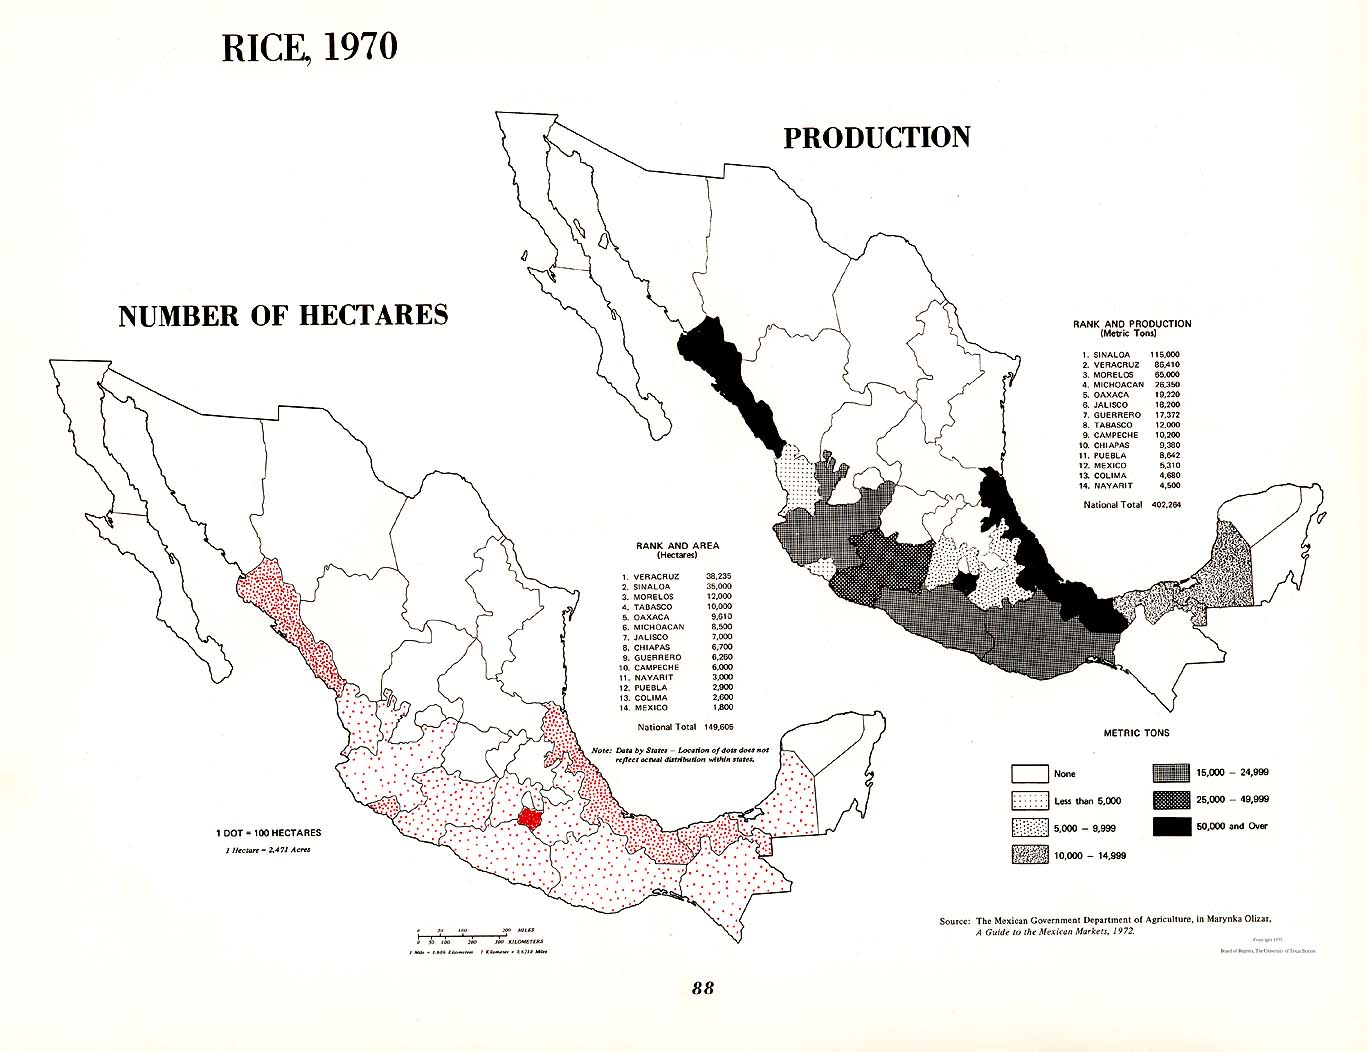
Rice, 1970: Number of Hectares; Production (177K)
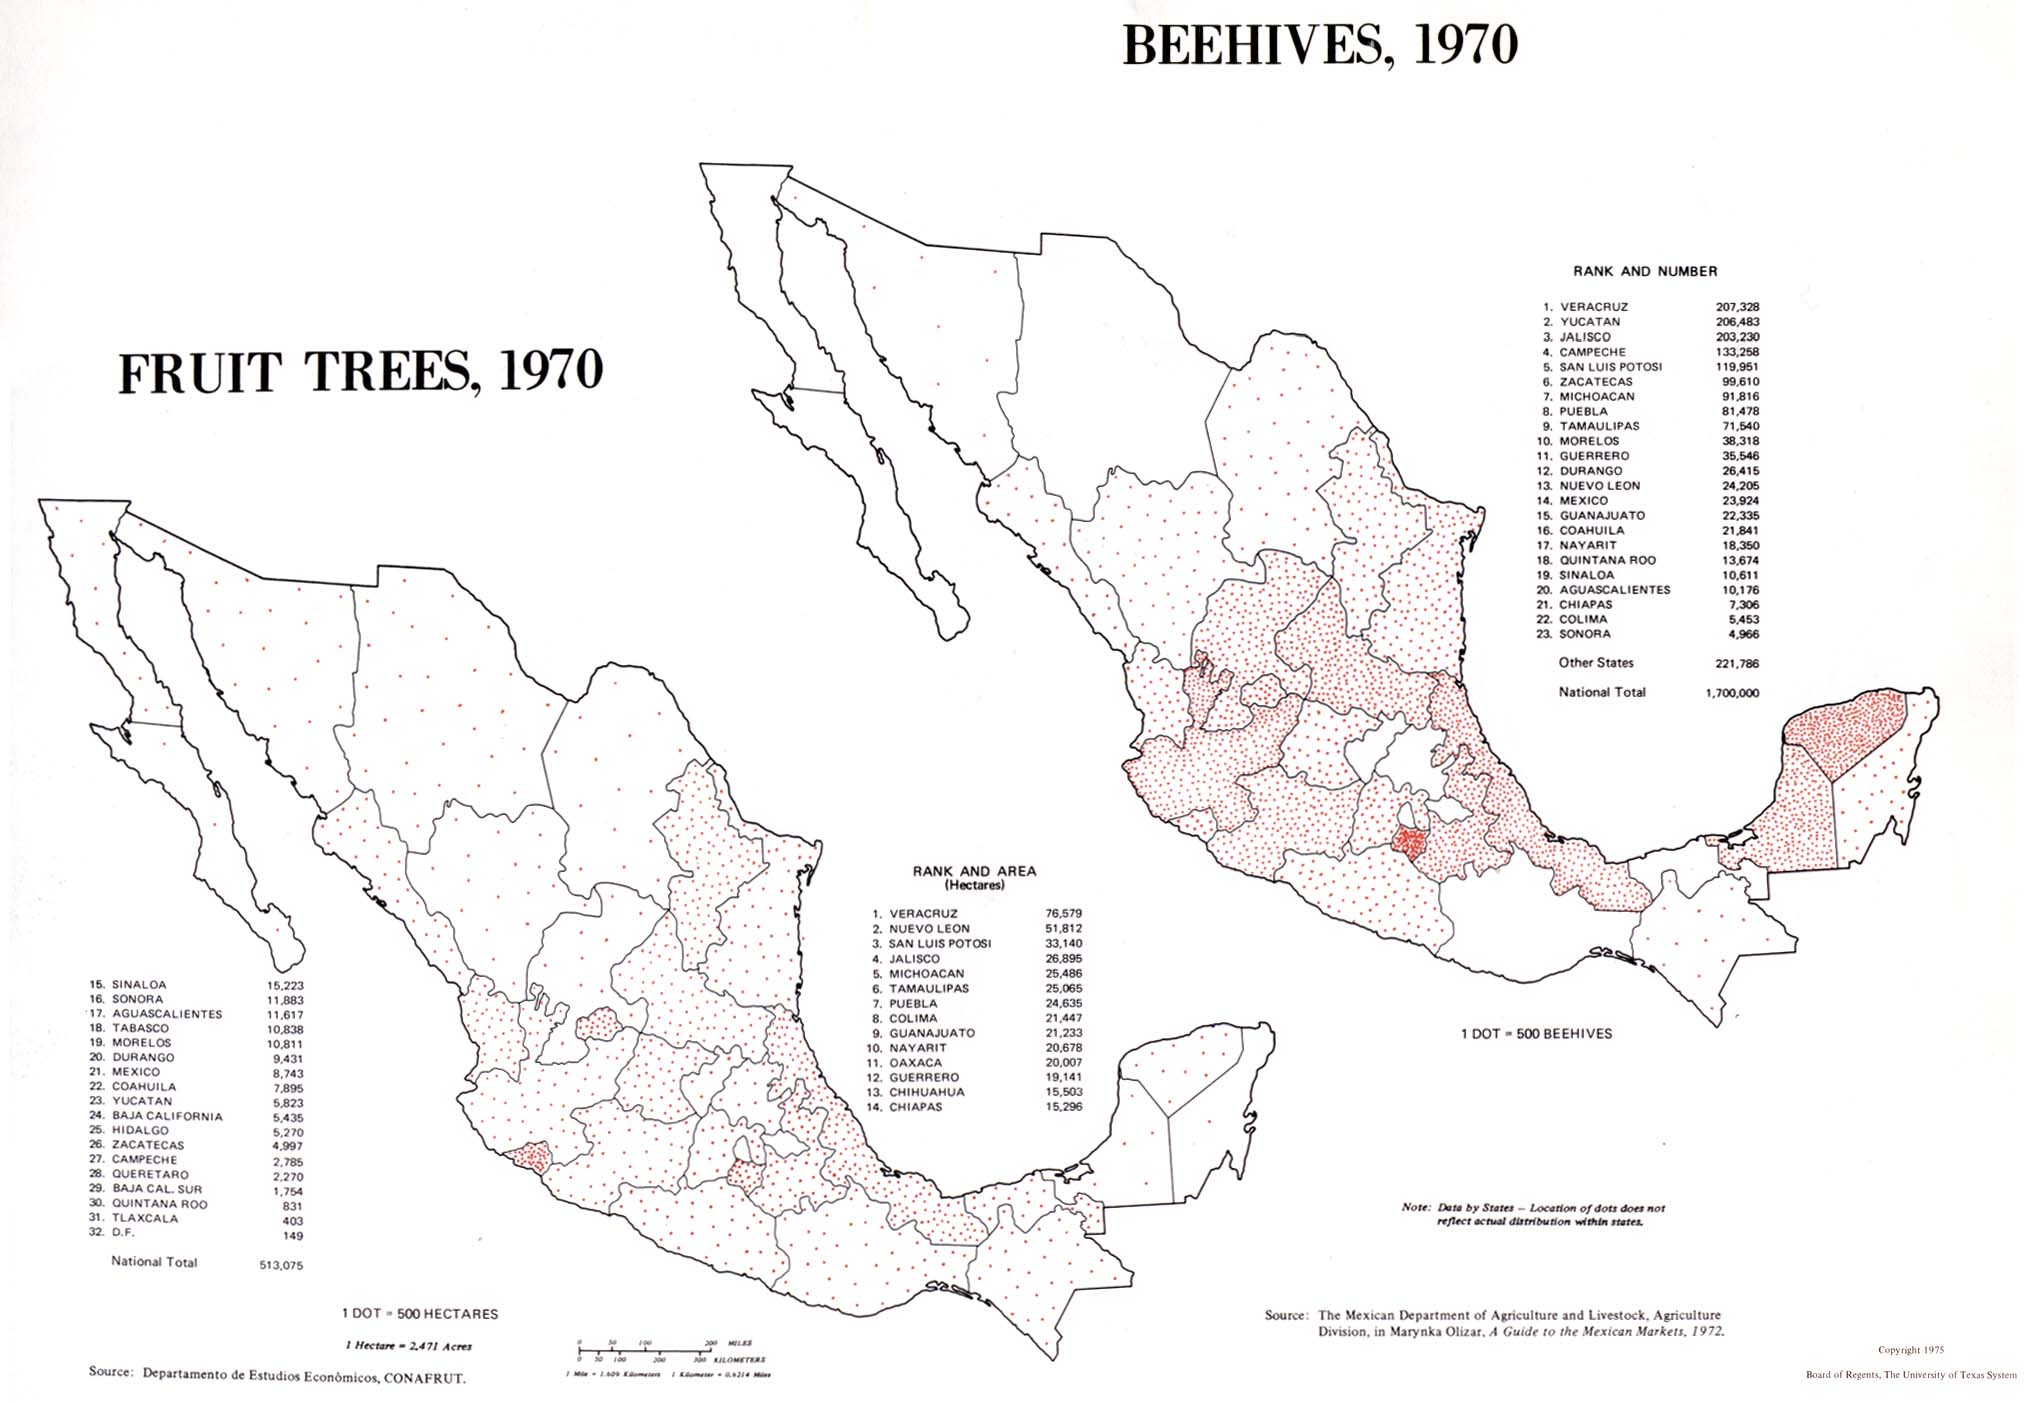
Fruit Trees, 1970; Bee Hives, 1970 (225K)
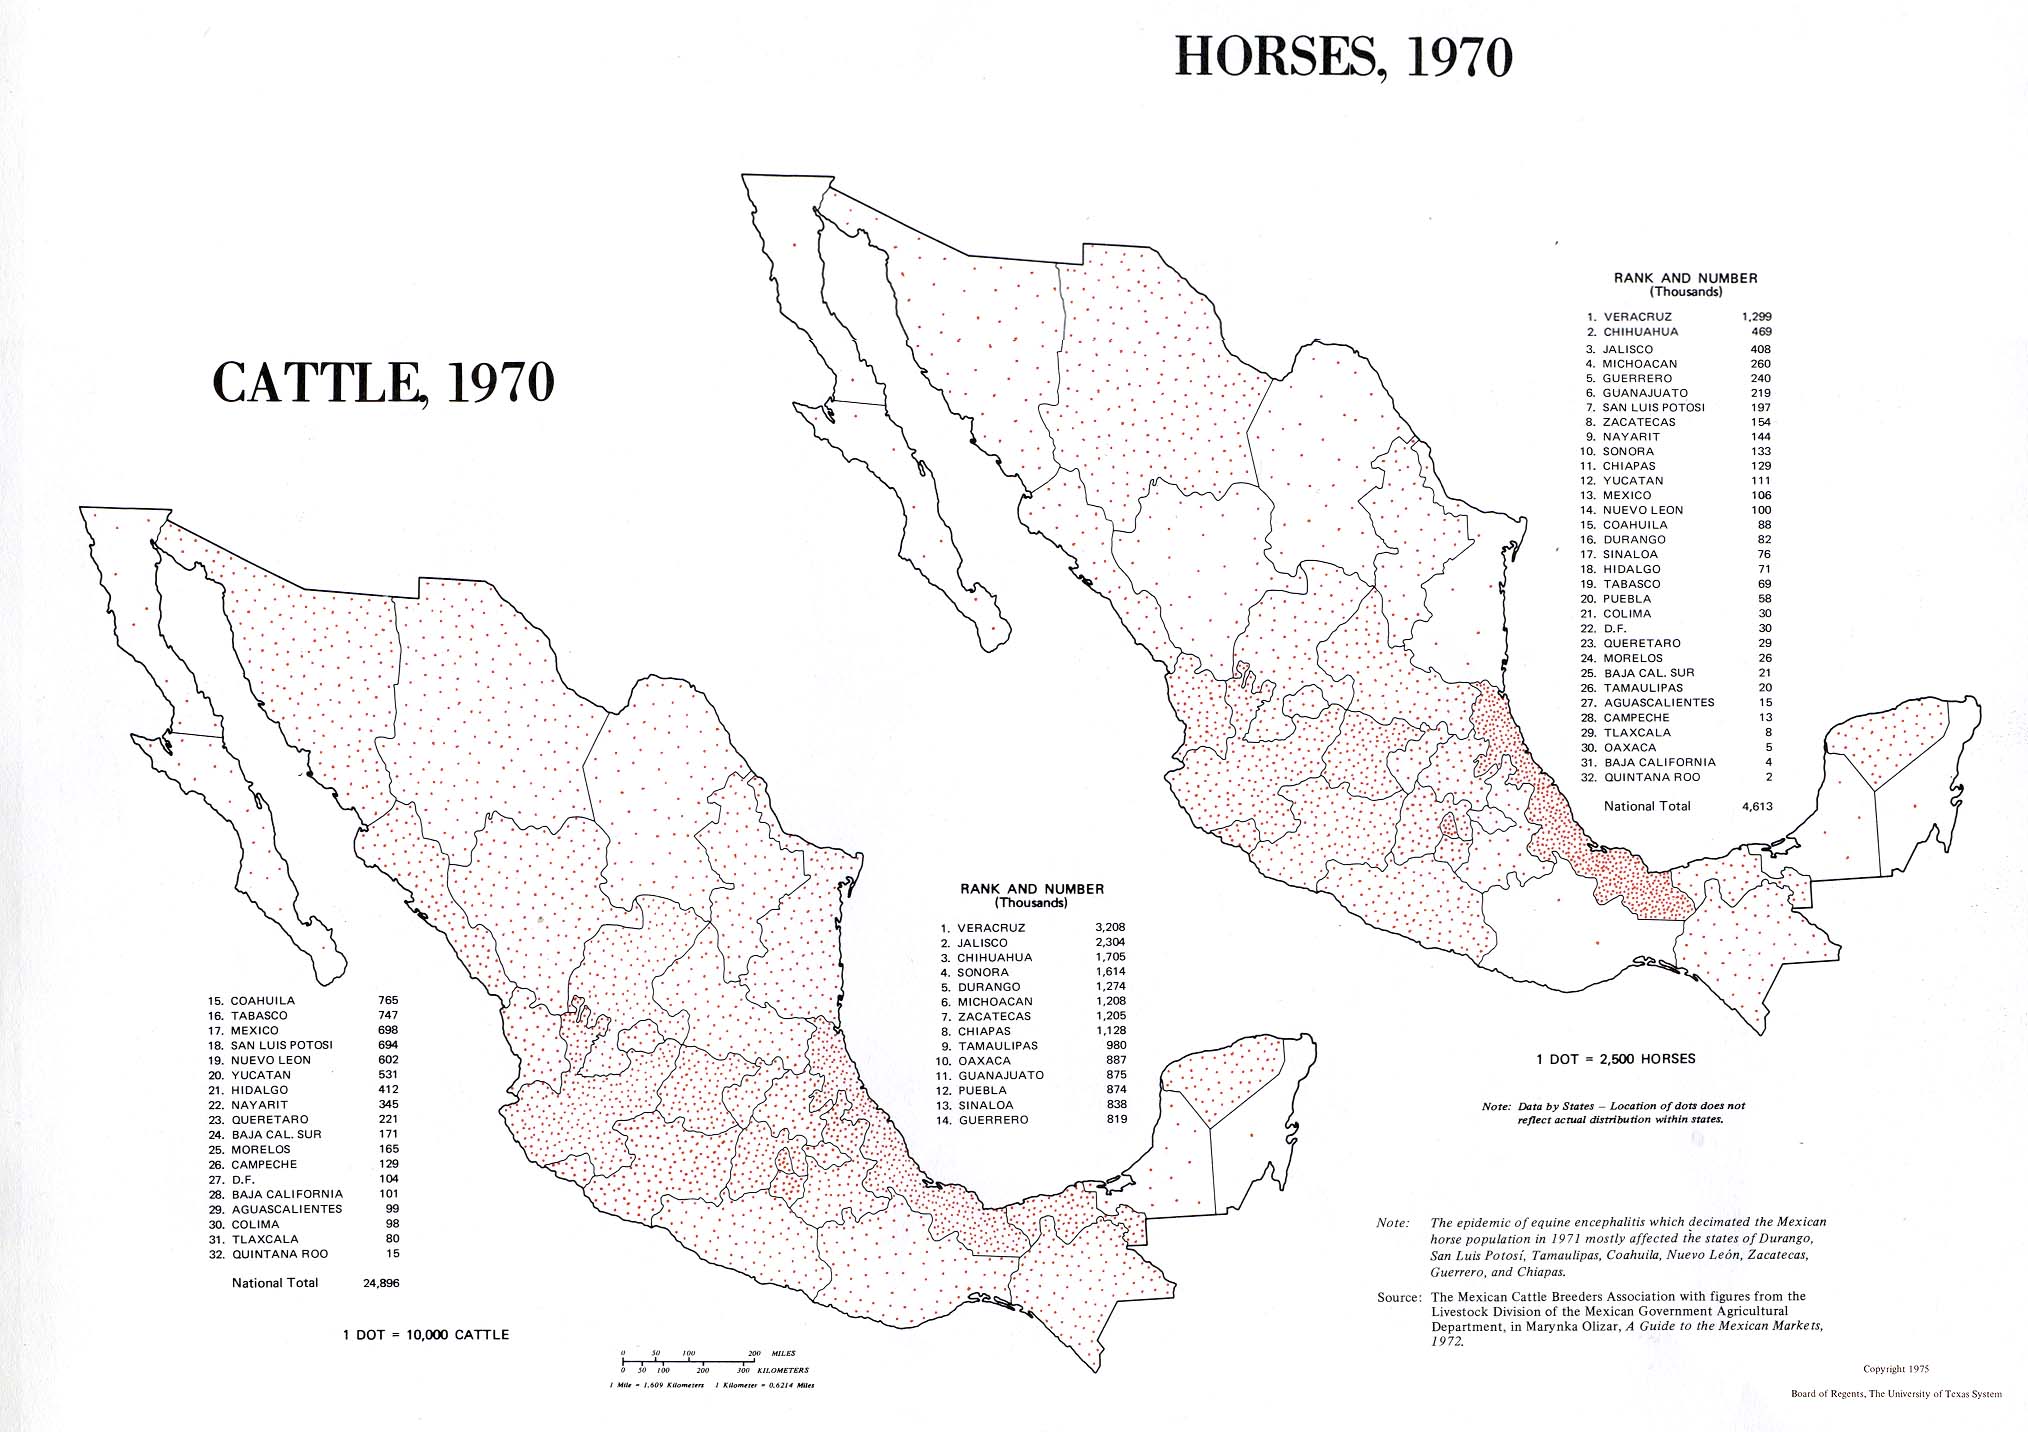
Cattle, 1970; Horses, 1970 (325K)
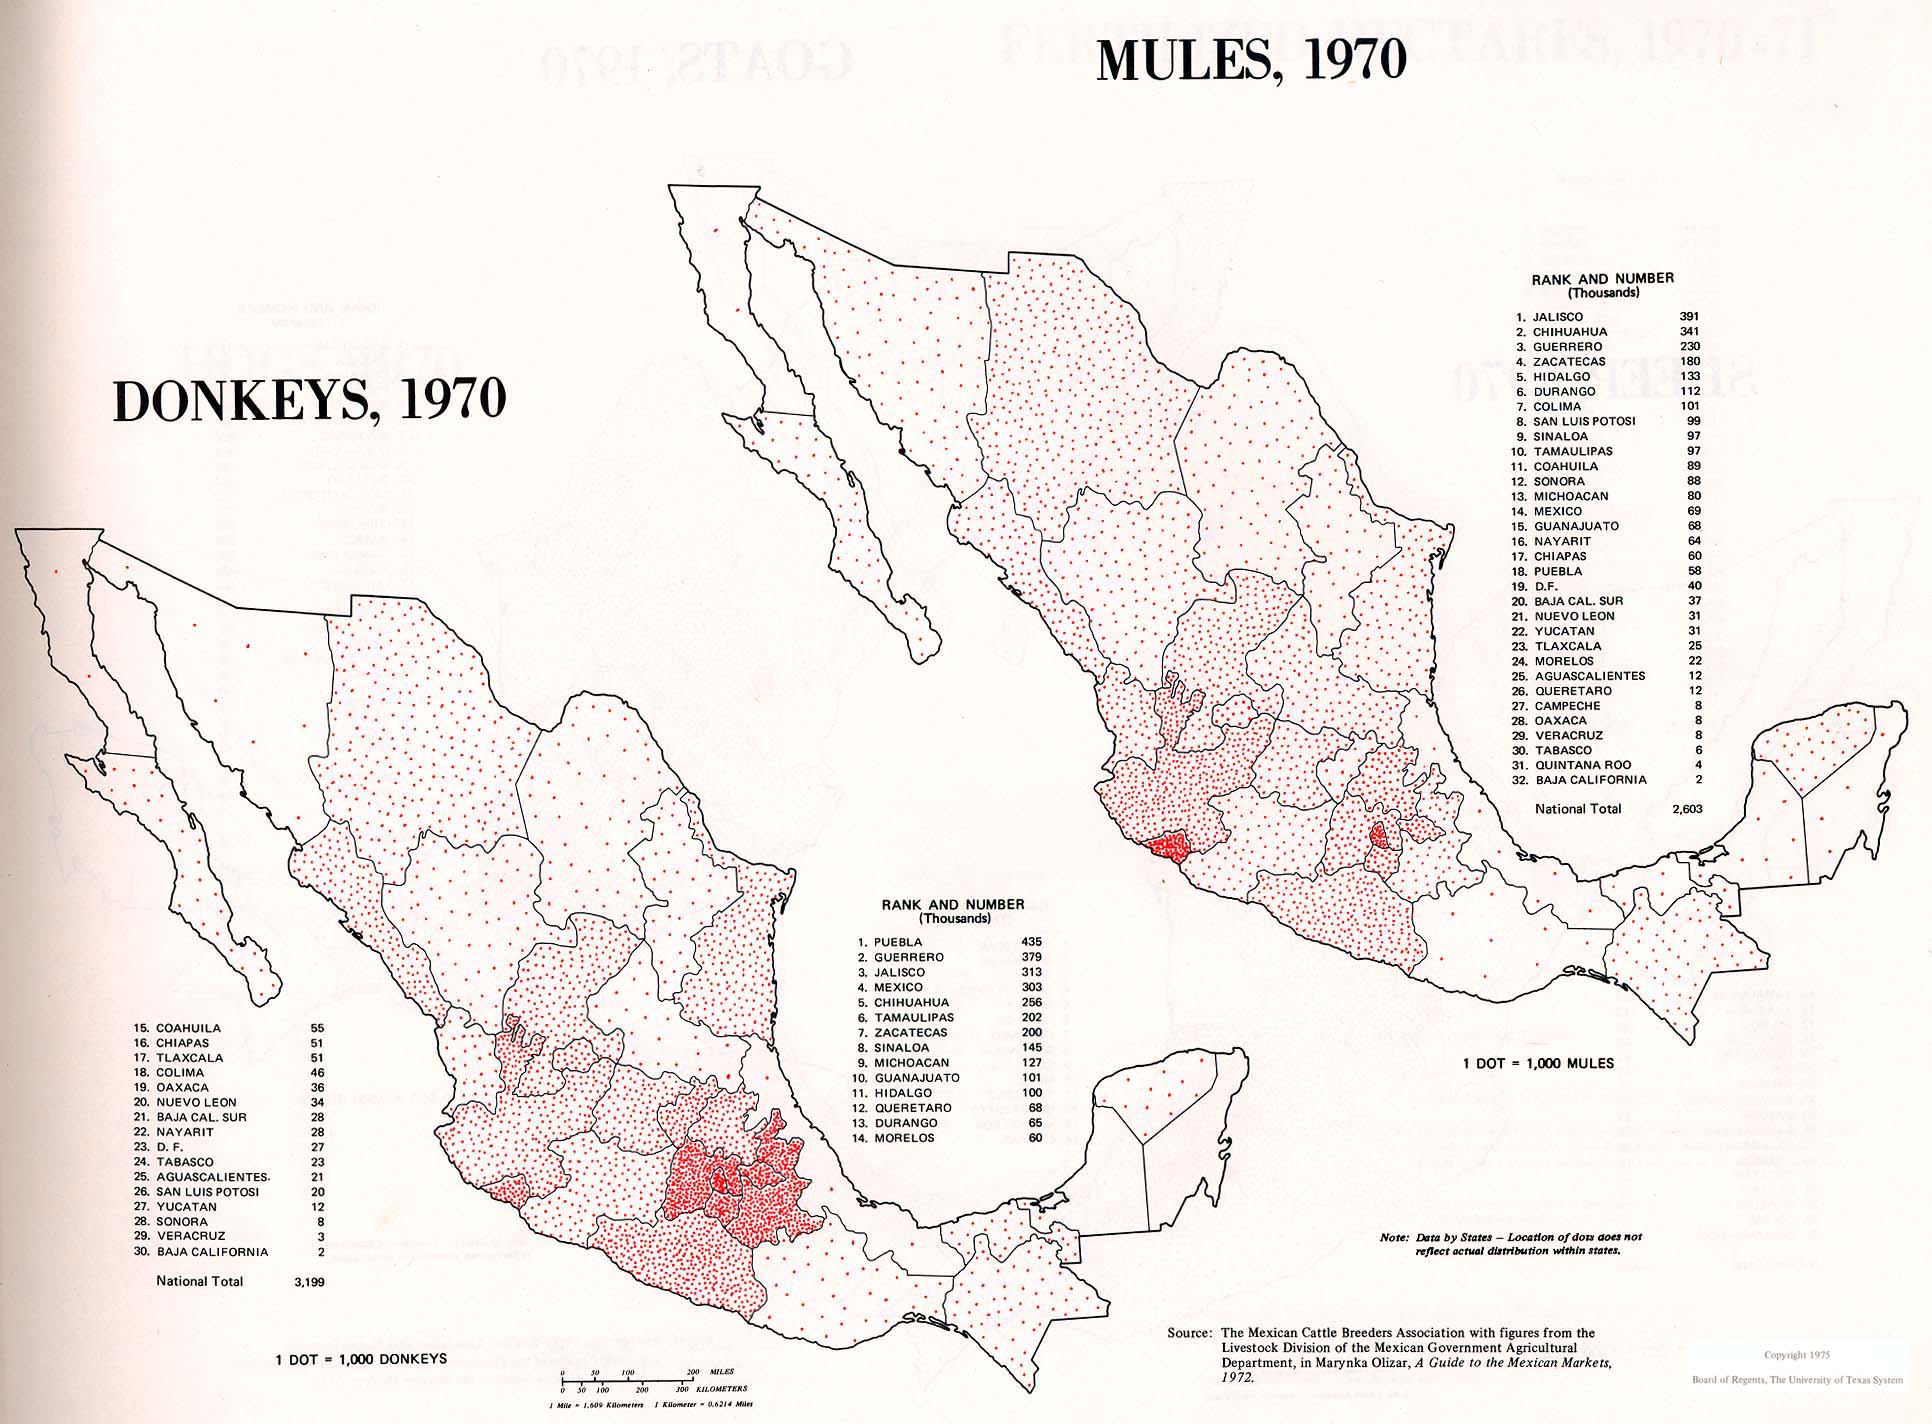
Donkeys, 1970; Mules, 1970 (333K)
Sheep, 1970; Goats, 1970 (309K)
Hogs, 1970; Fertilized Hectares, 1970-1971 (393K)
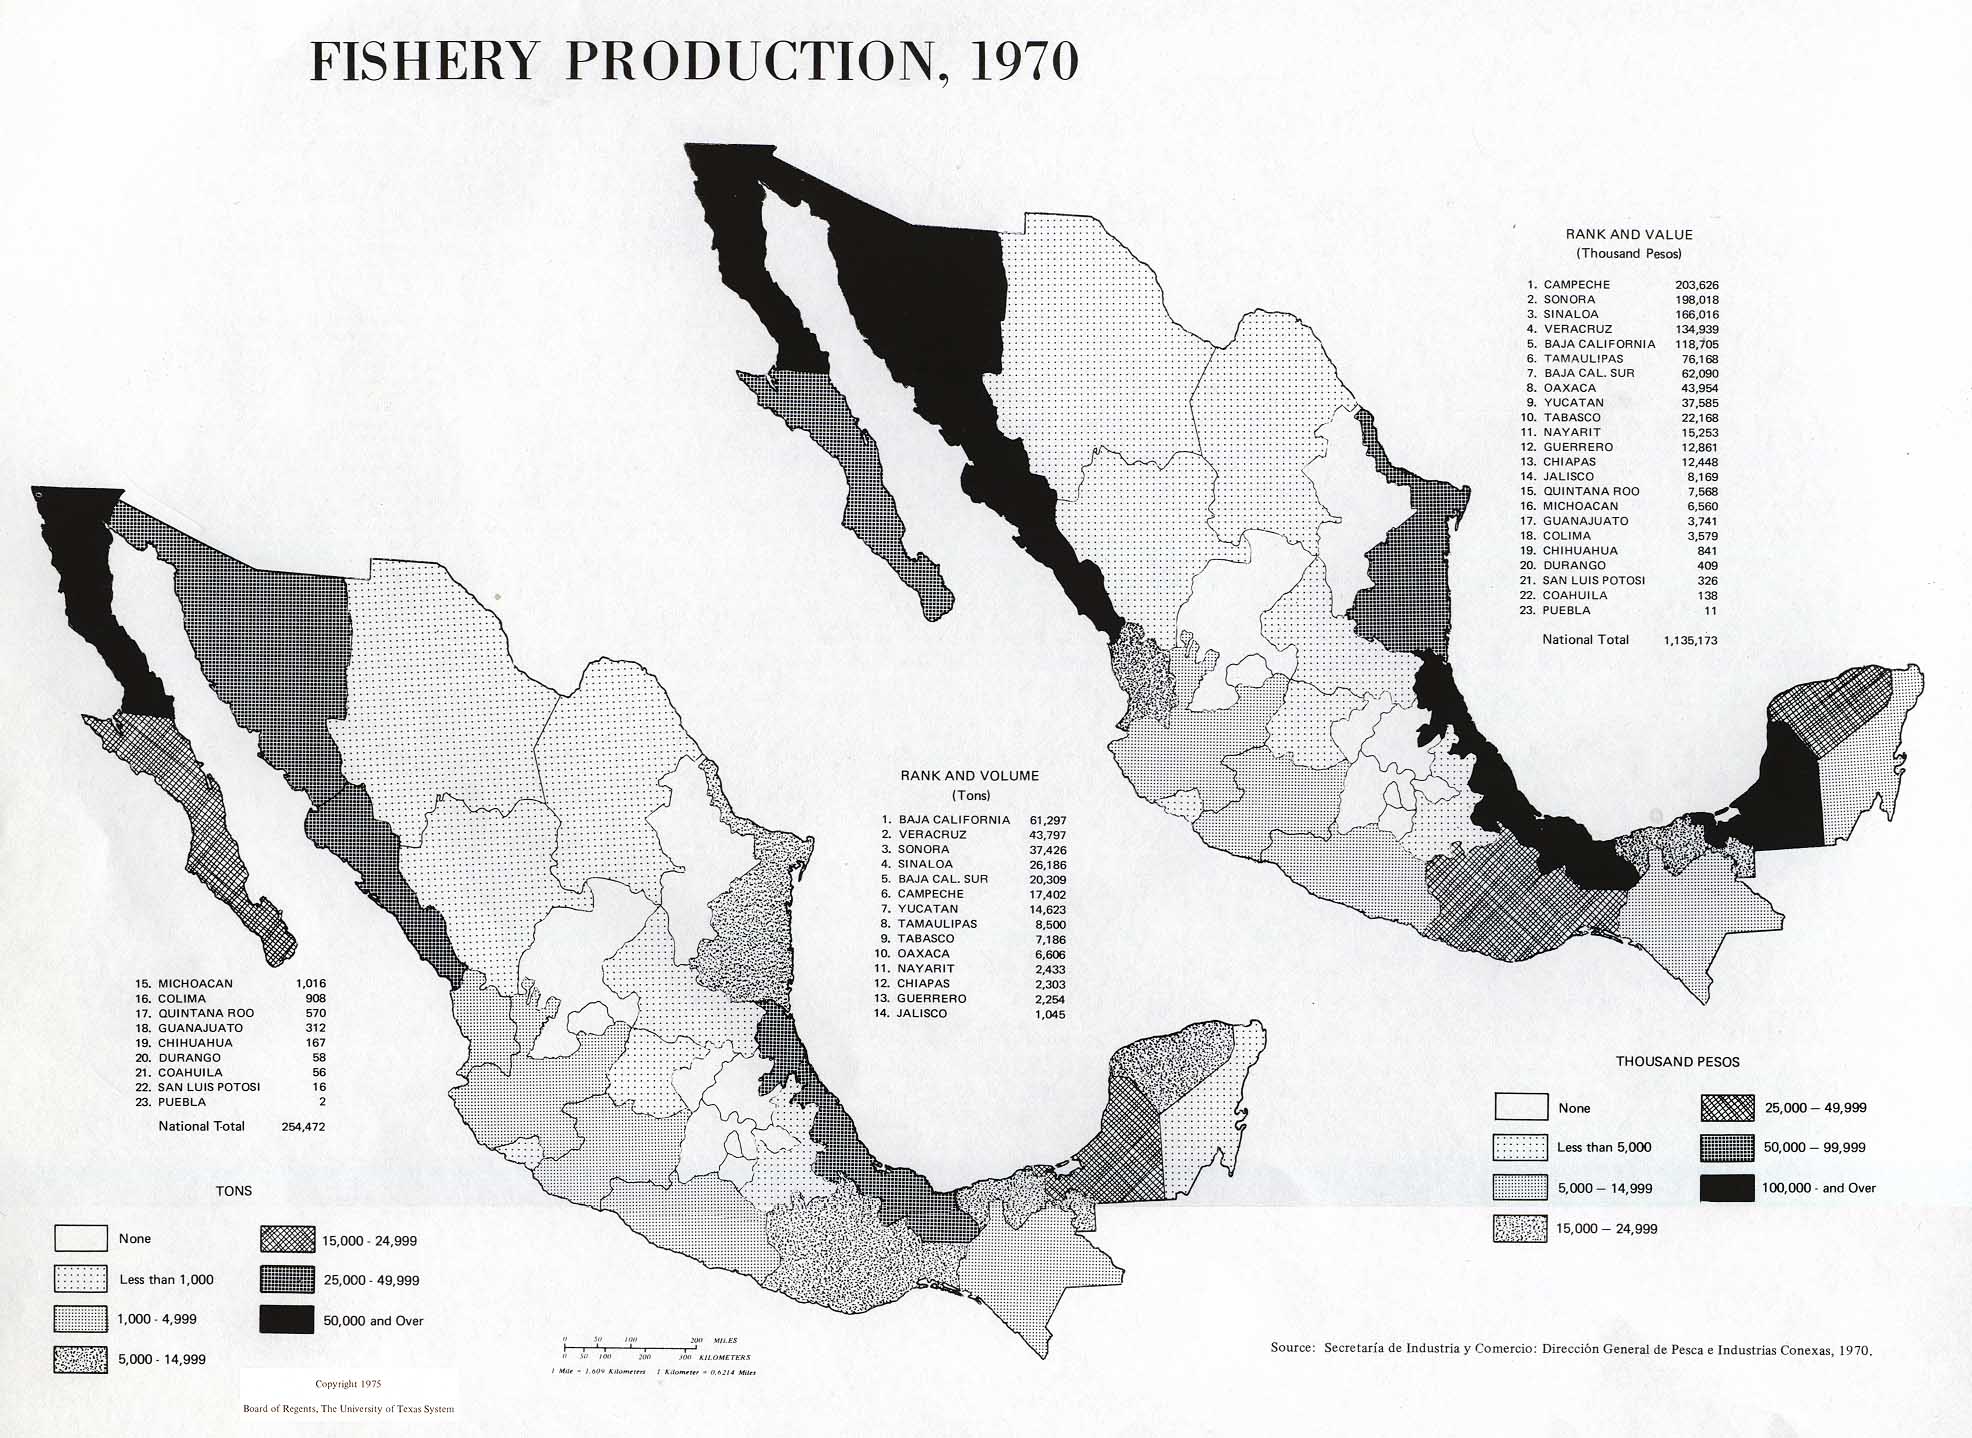
Fishery Production, 1970 (392K)
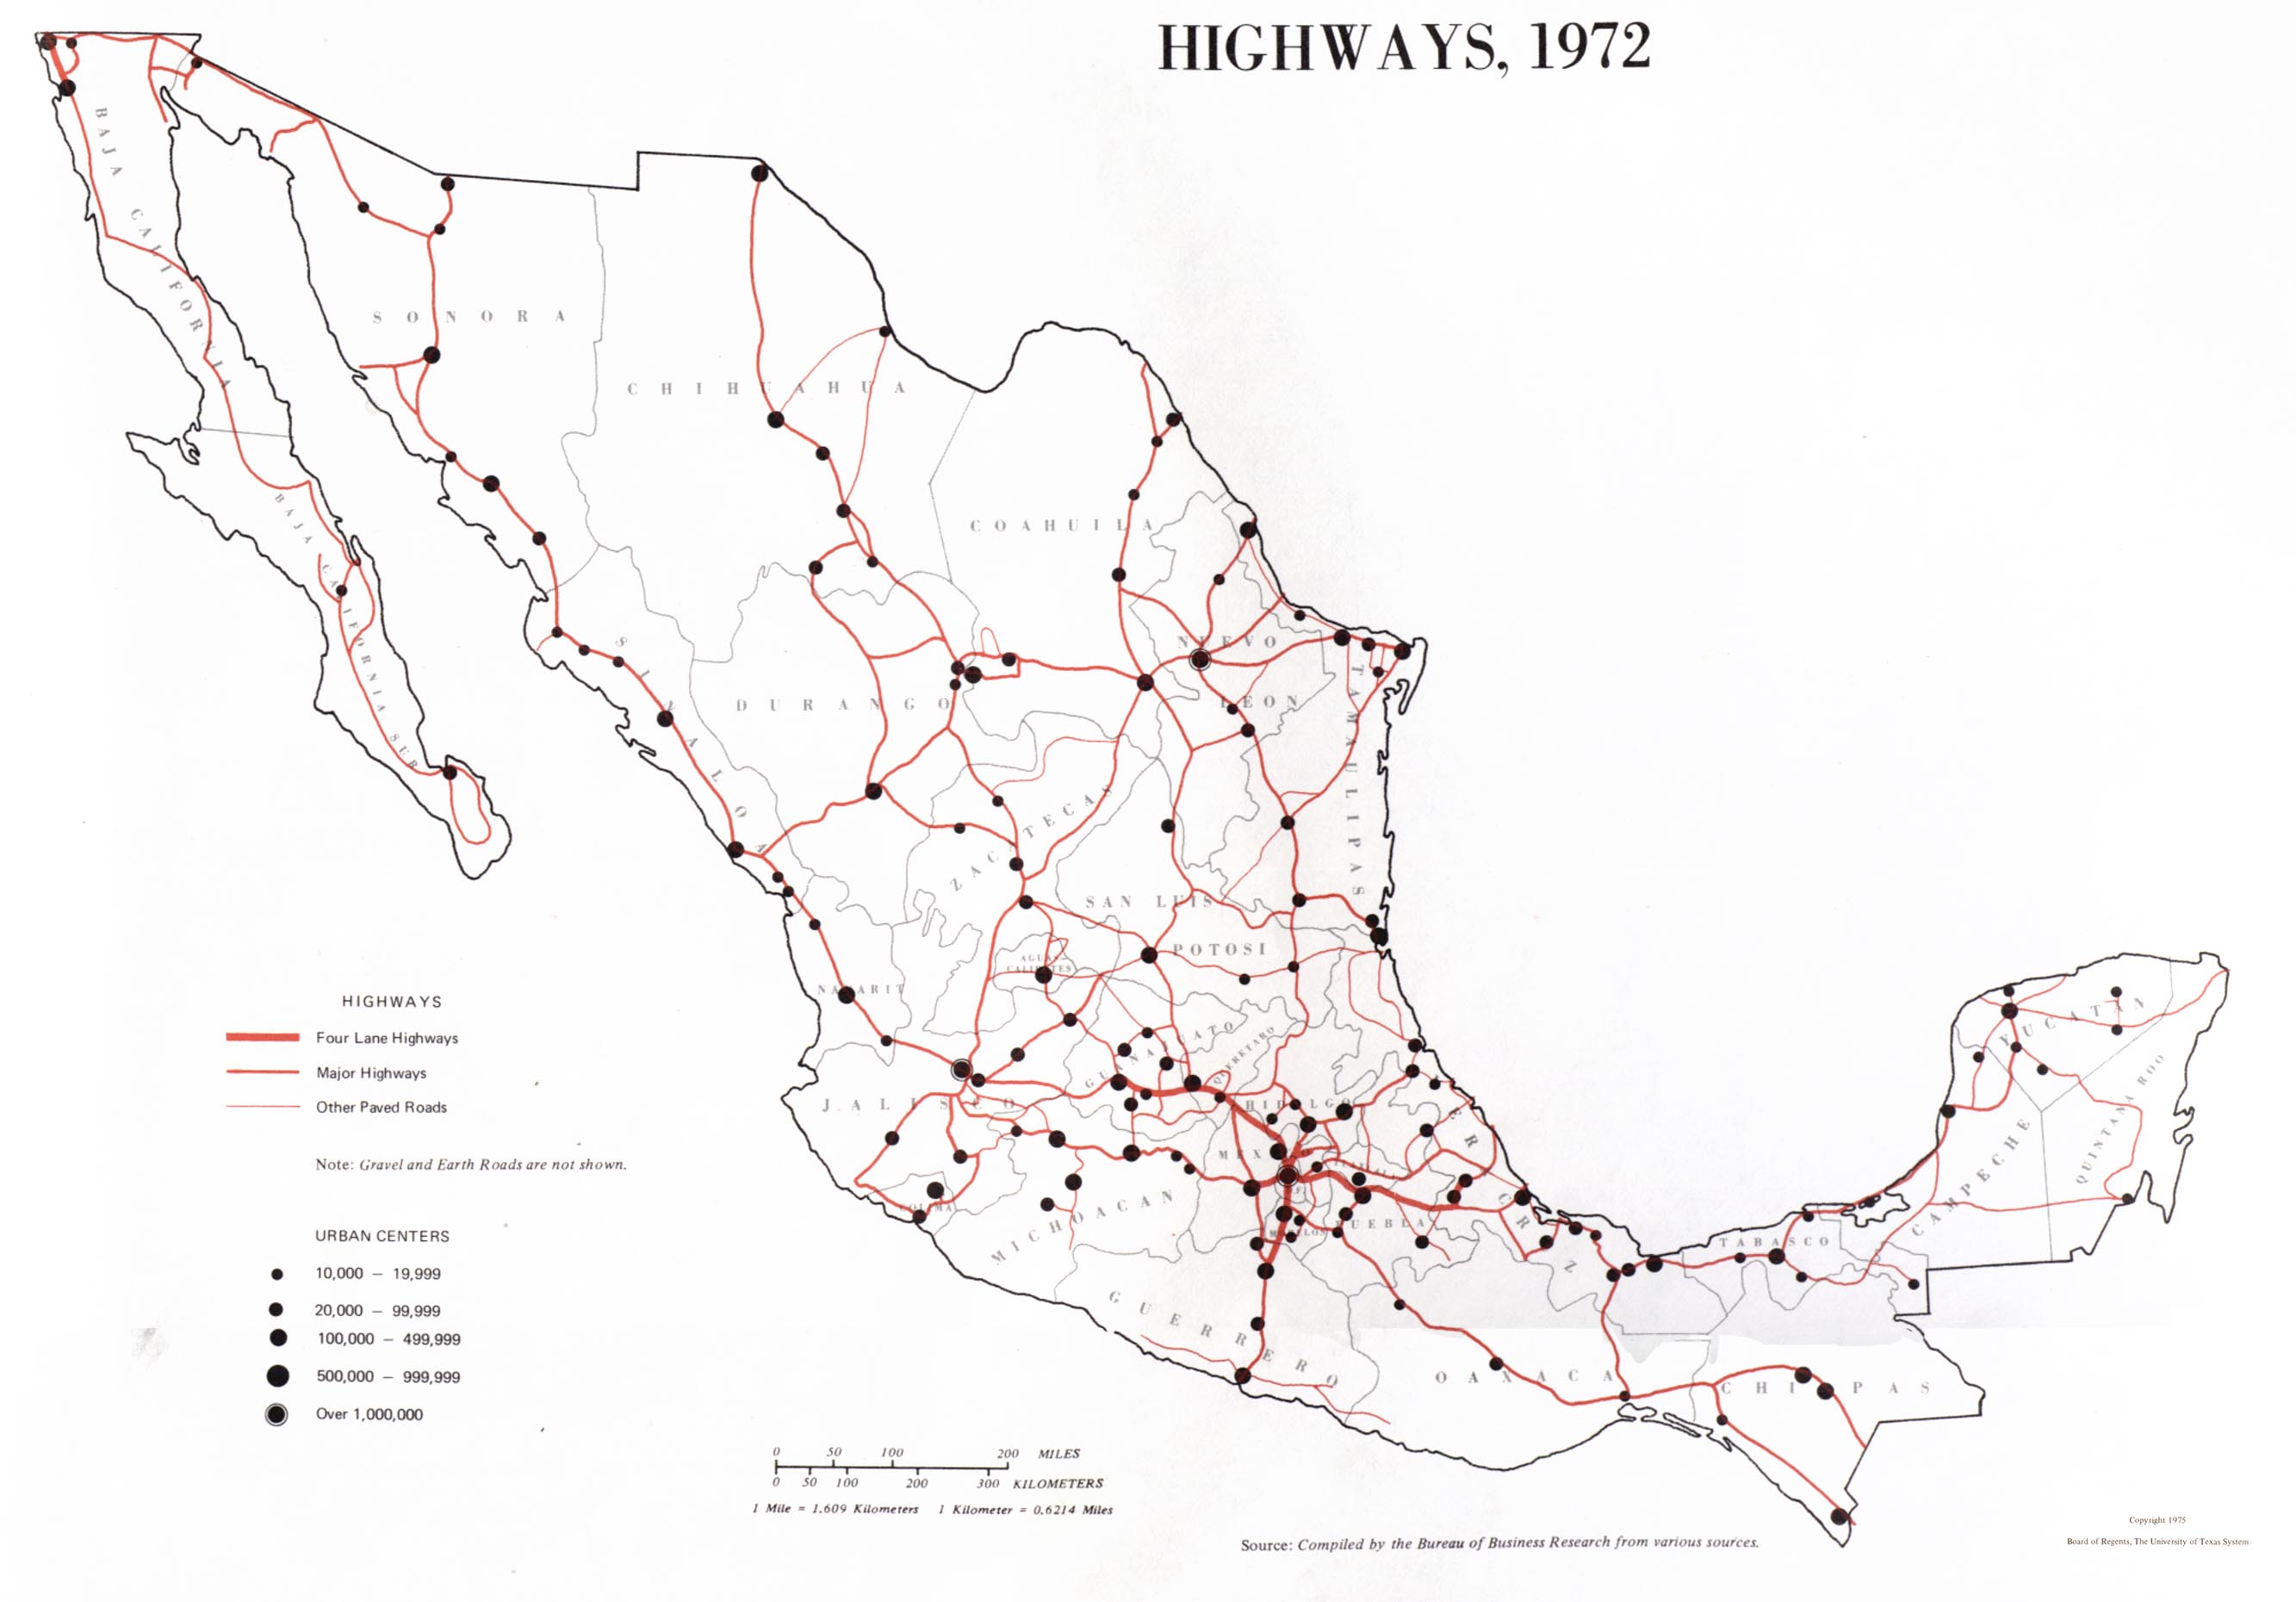
Highways, 1972 (318K)
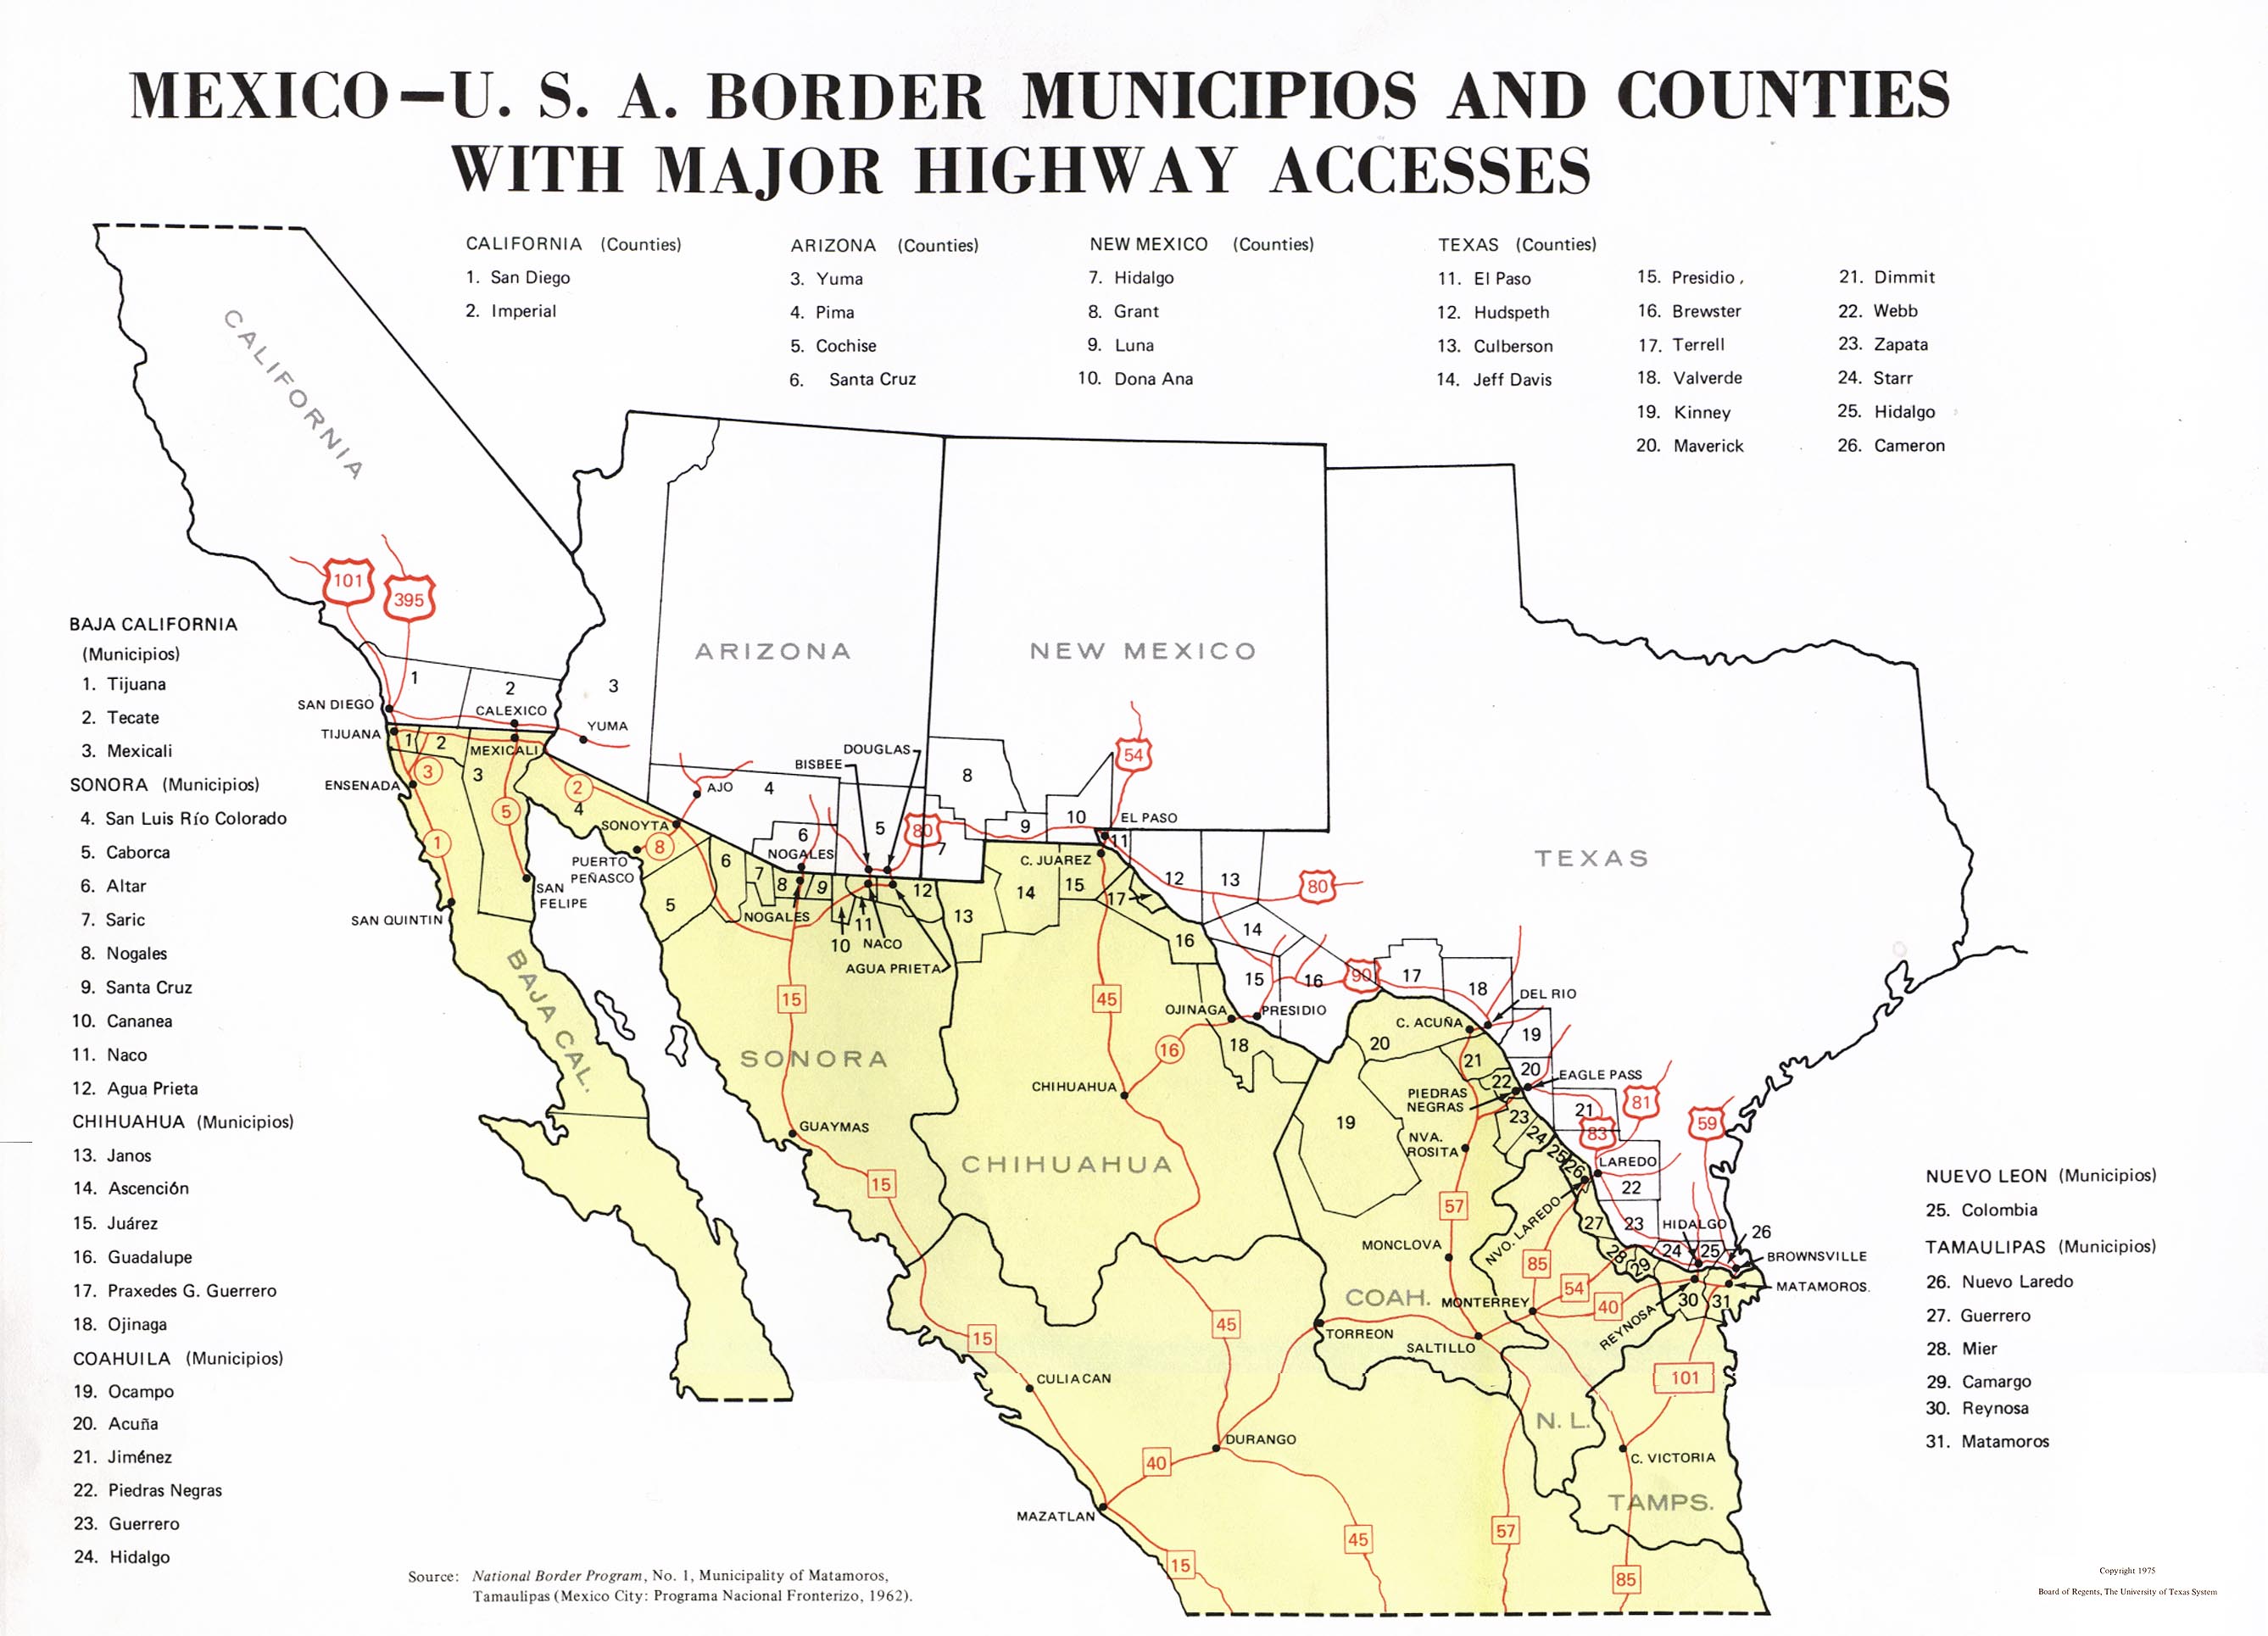
Mexico-U.S.A. Border Municipios and Counties with Major Highway Accesses (279K)
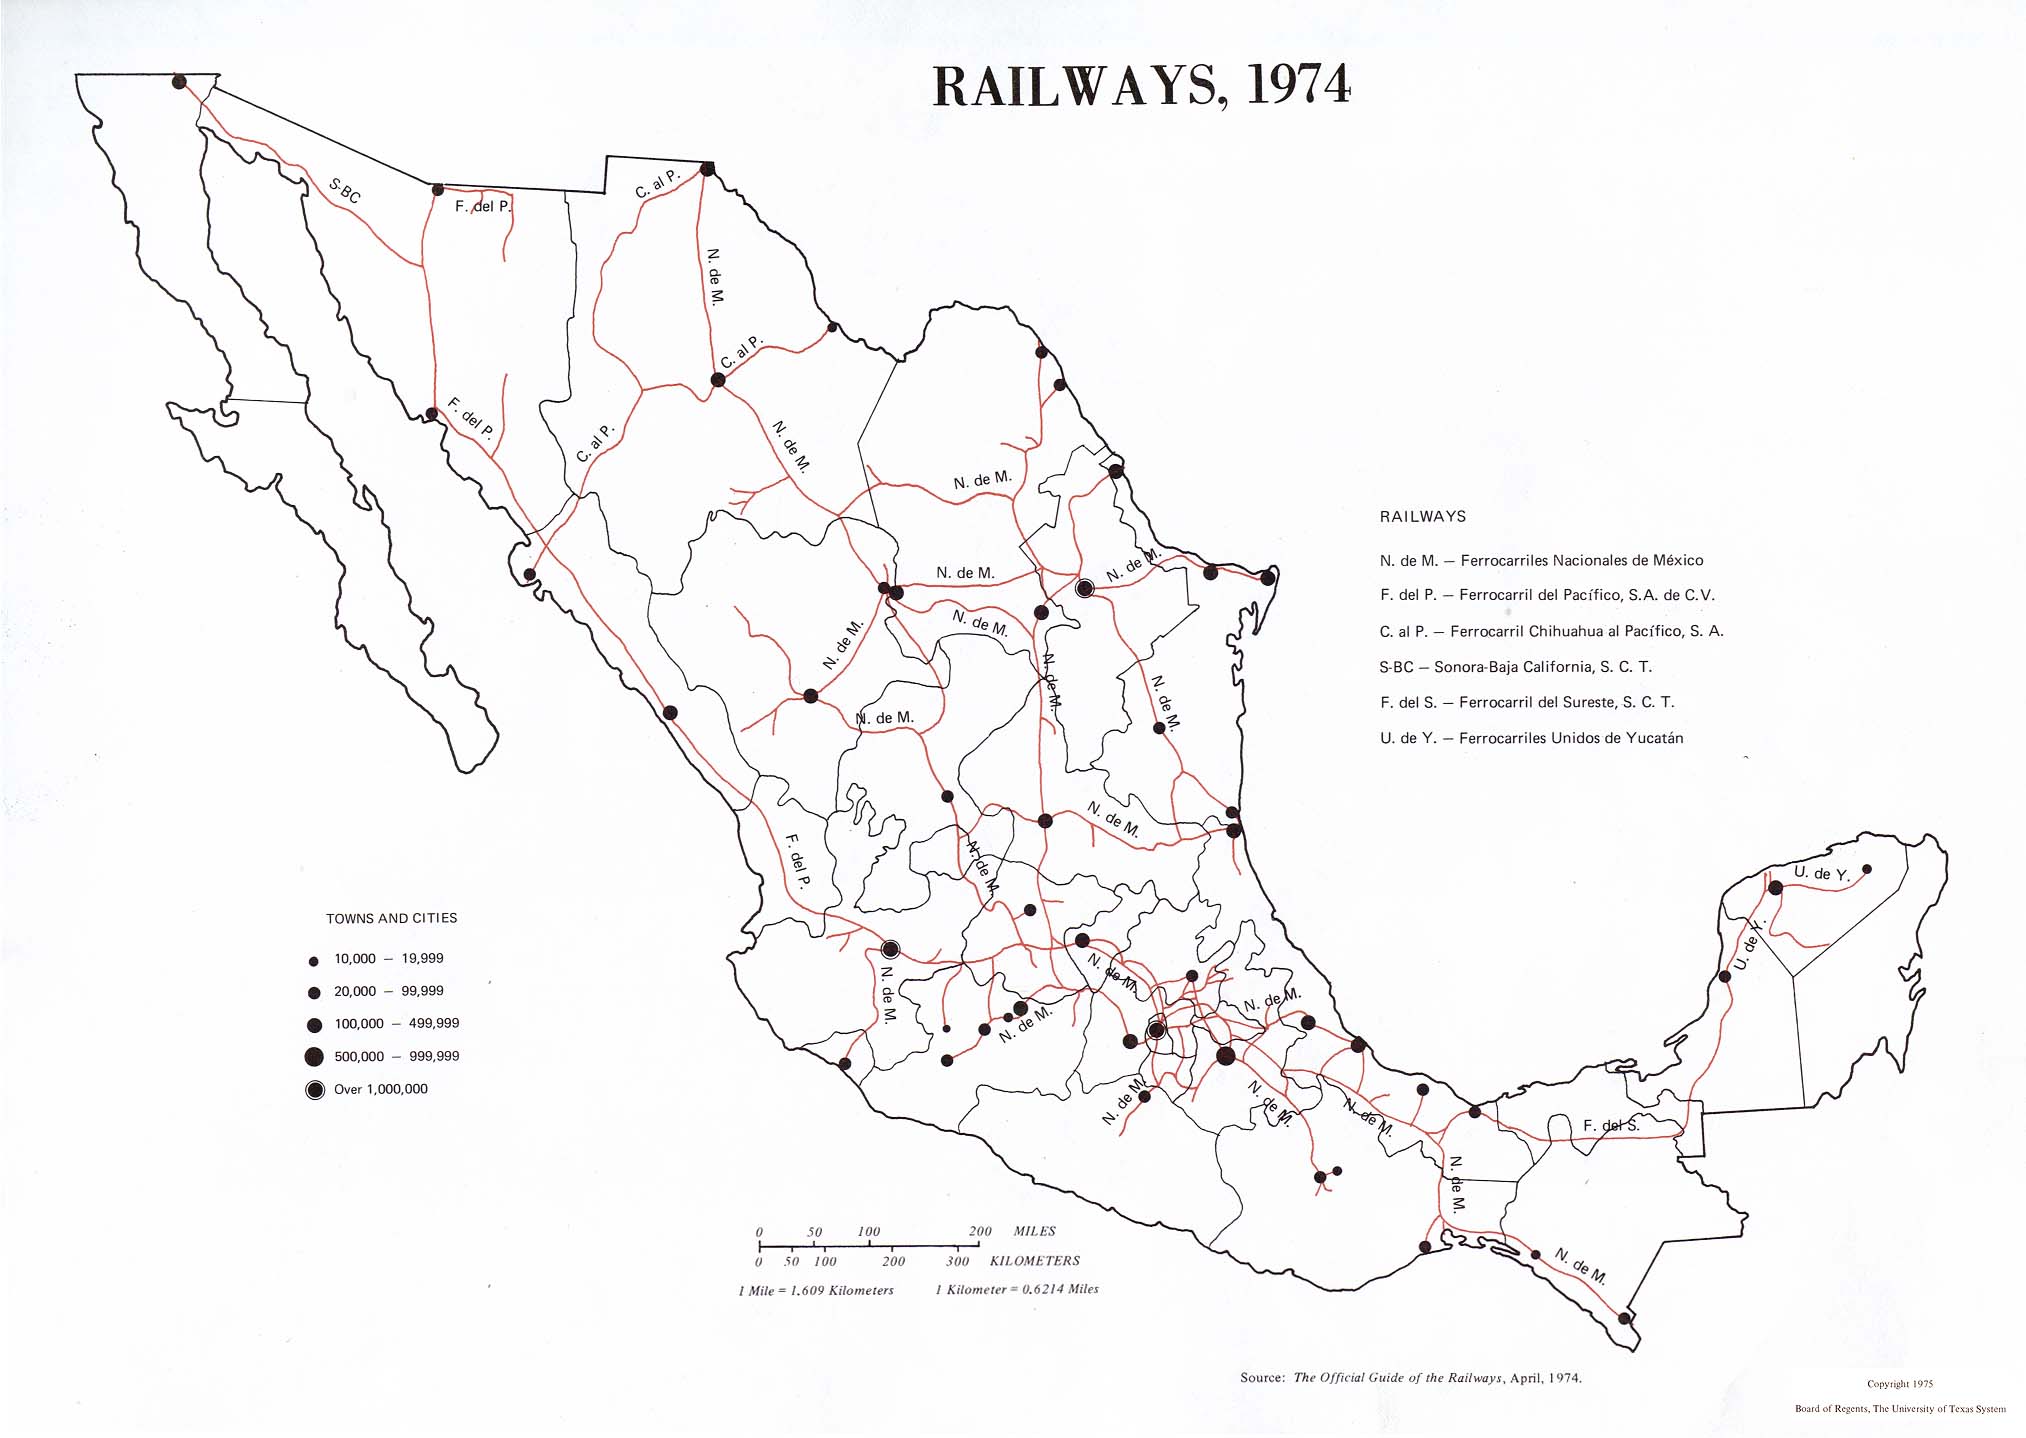
Railways, 1974 (318K)
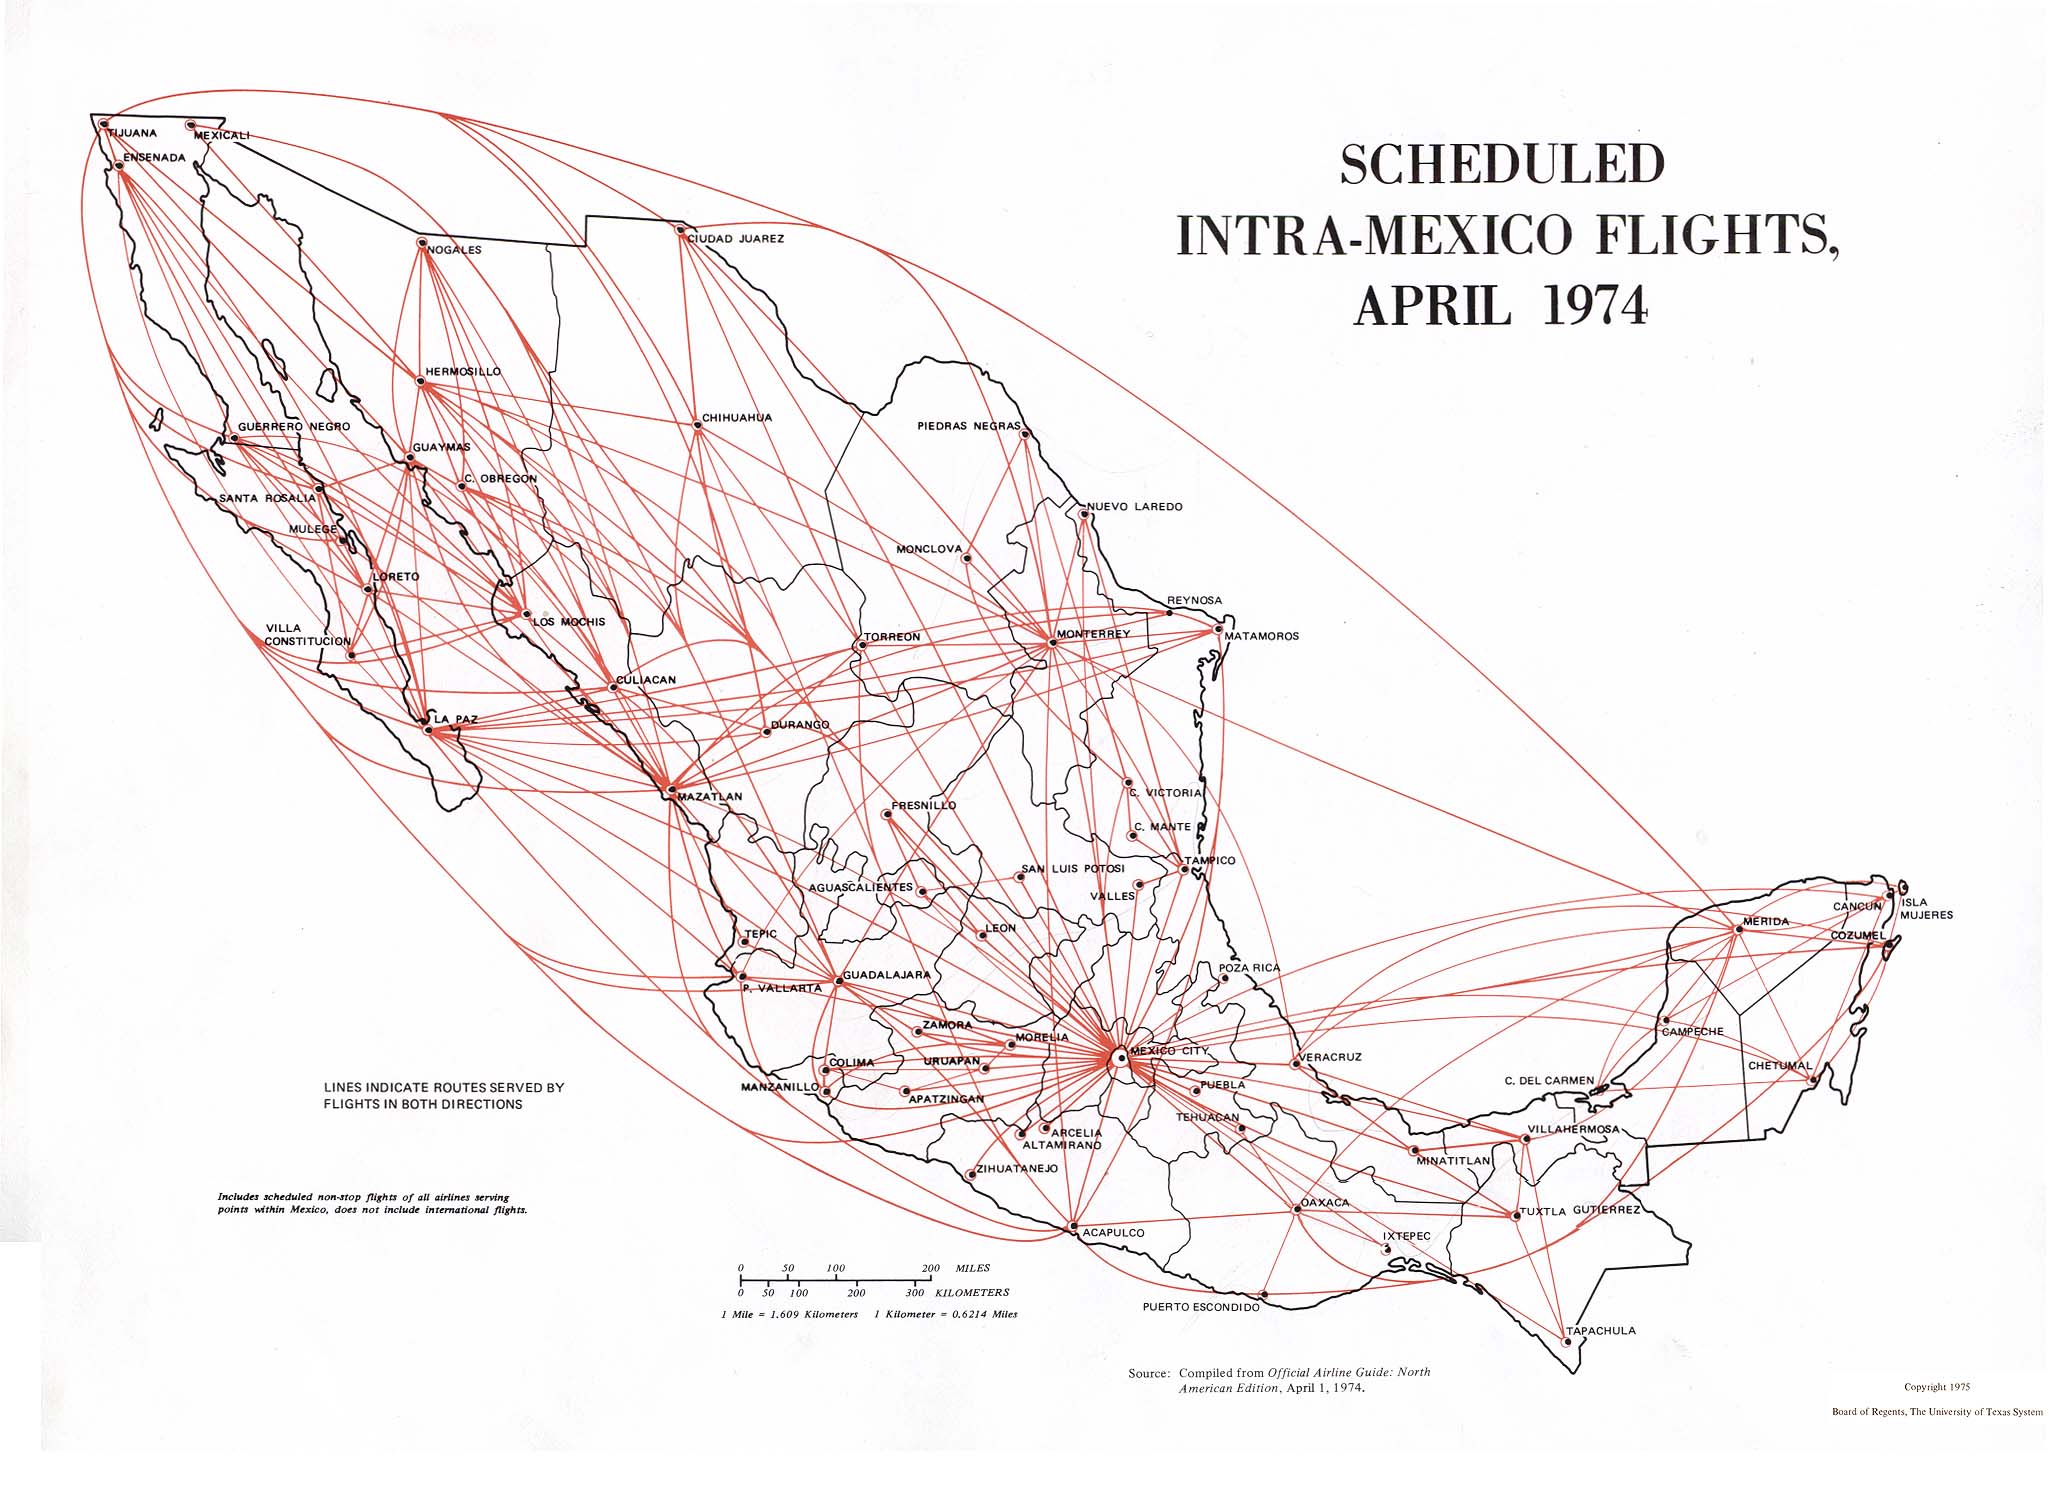
Scheduled Intra-Mexico Flights, April 1974 (339K)
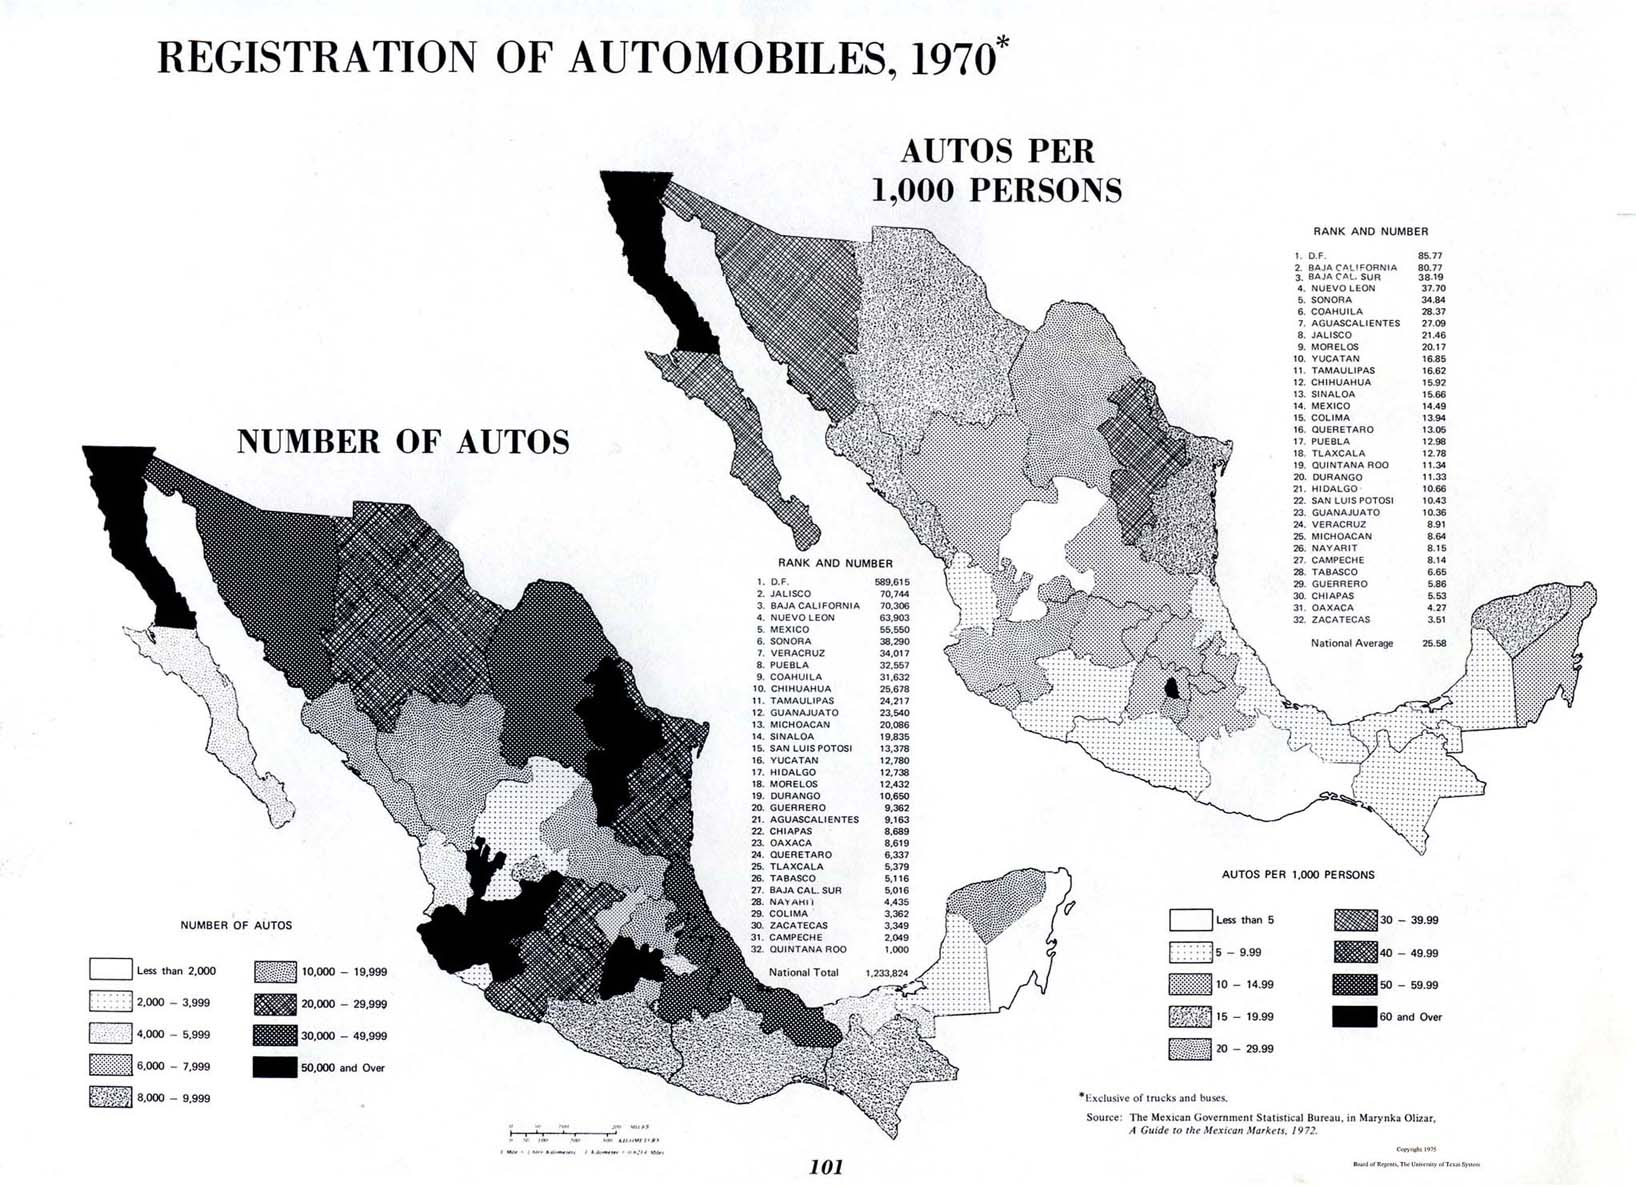
Registration of Automobiles, 1970: Number of Autos: Autos per 1,000 Persons (296K)
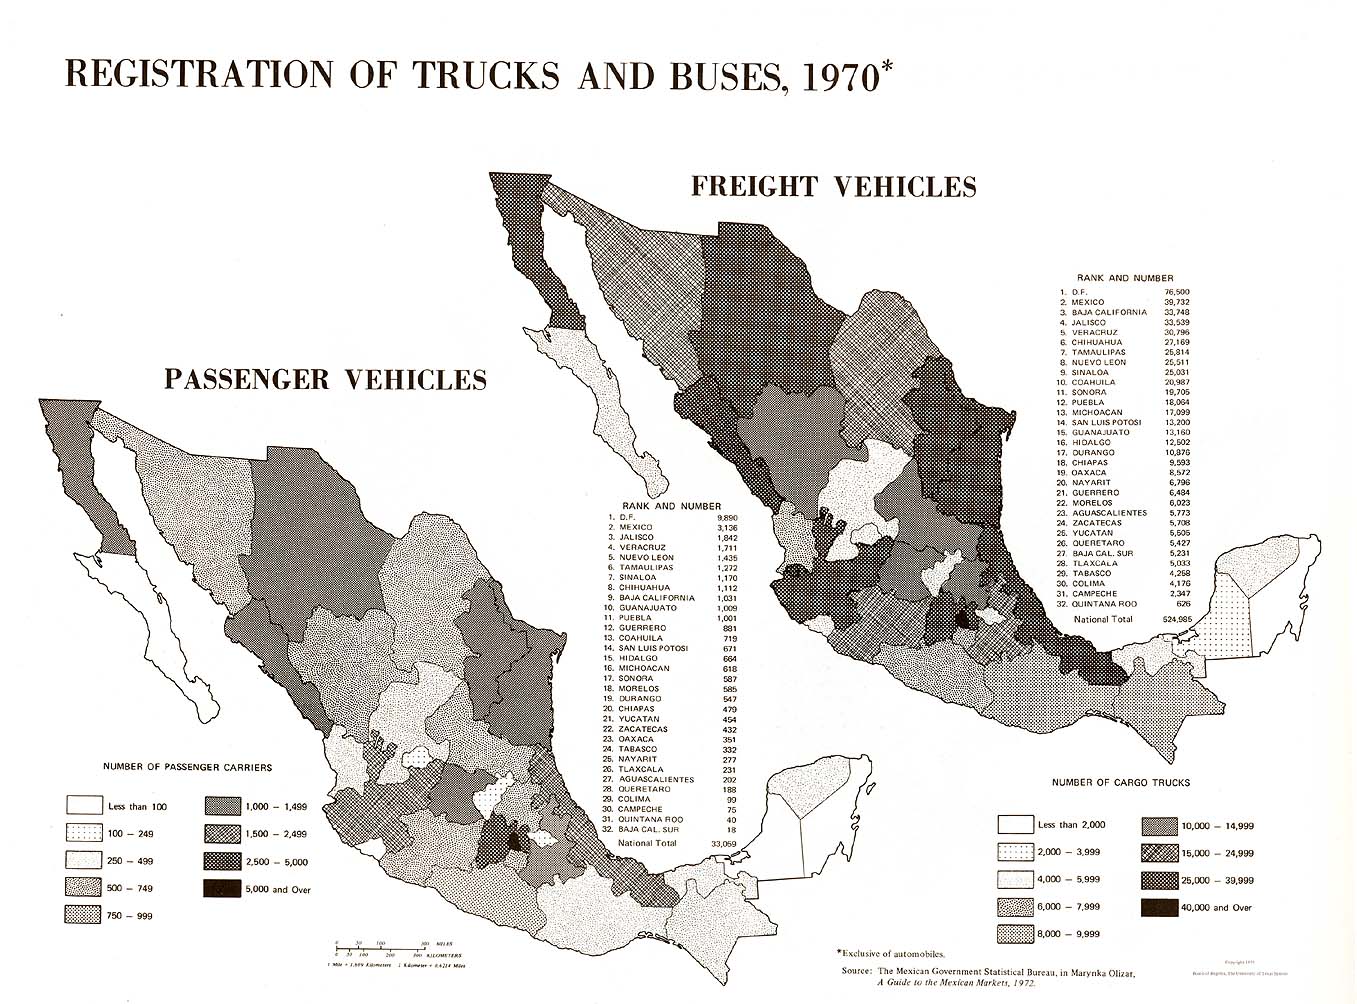
Registration of Trucks and Buses, 1970: Passenger Vehicles; Freight Vehicles (298K)
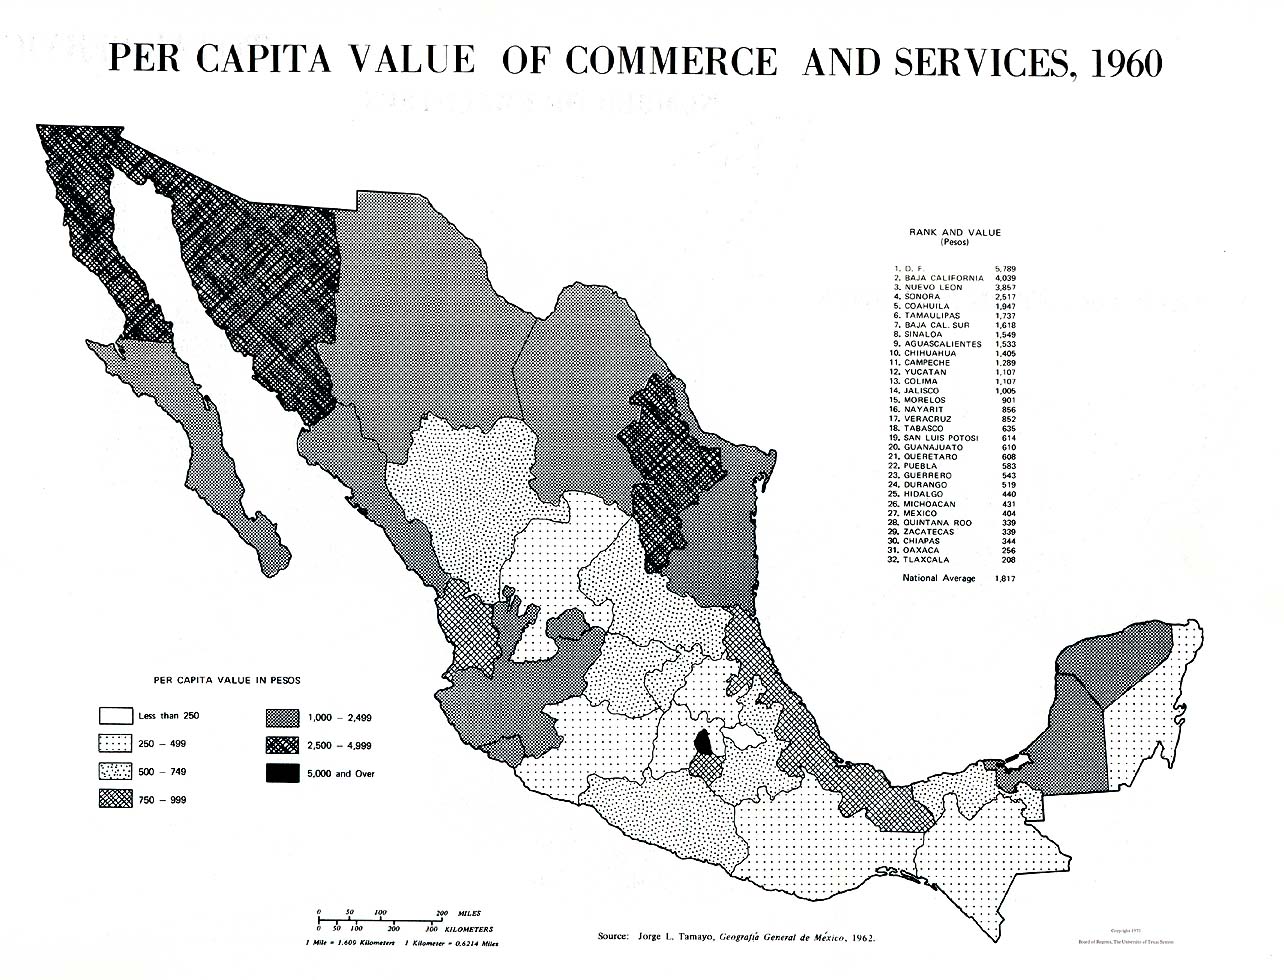
Per Capita Value of Commerce and Services, 1960 (287K)
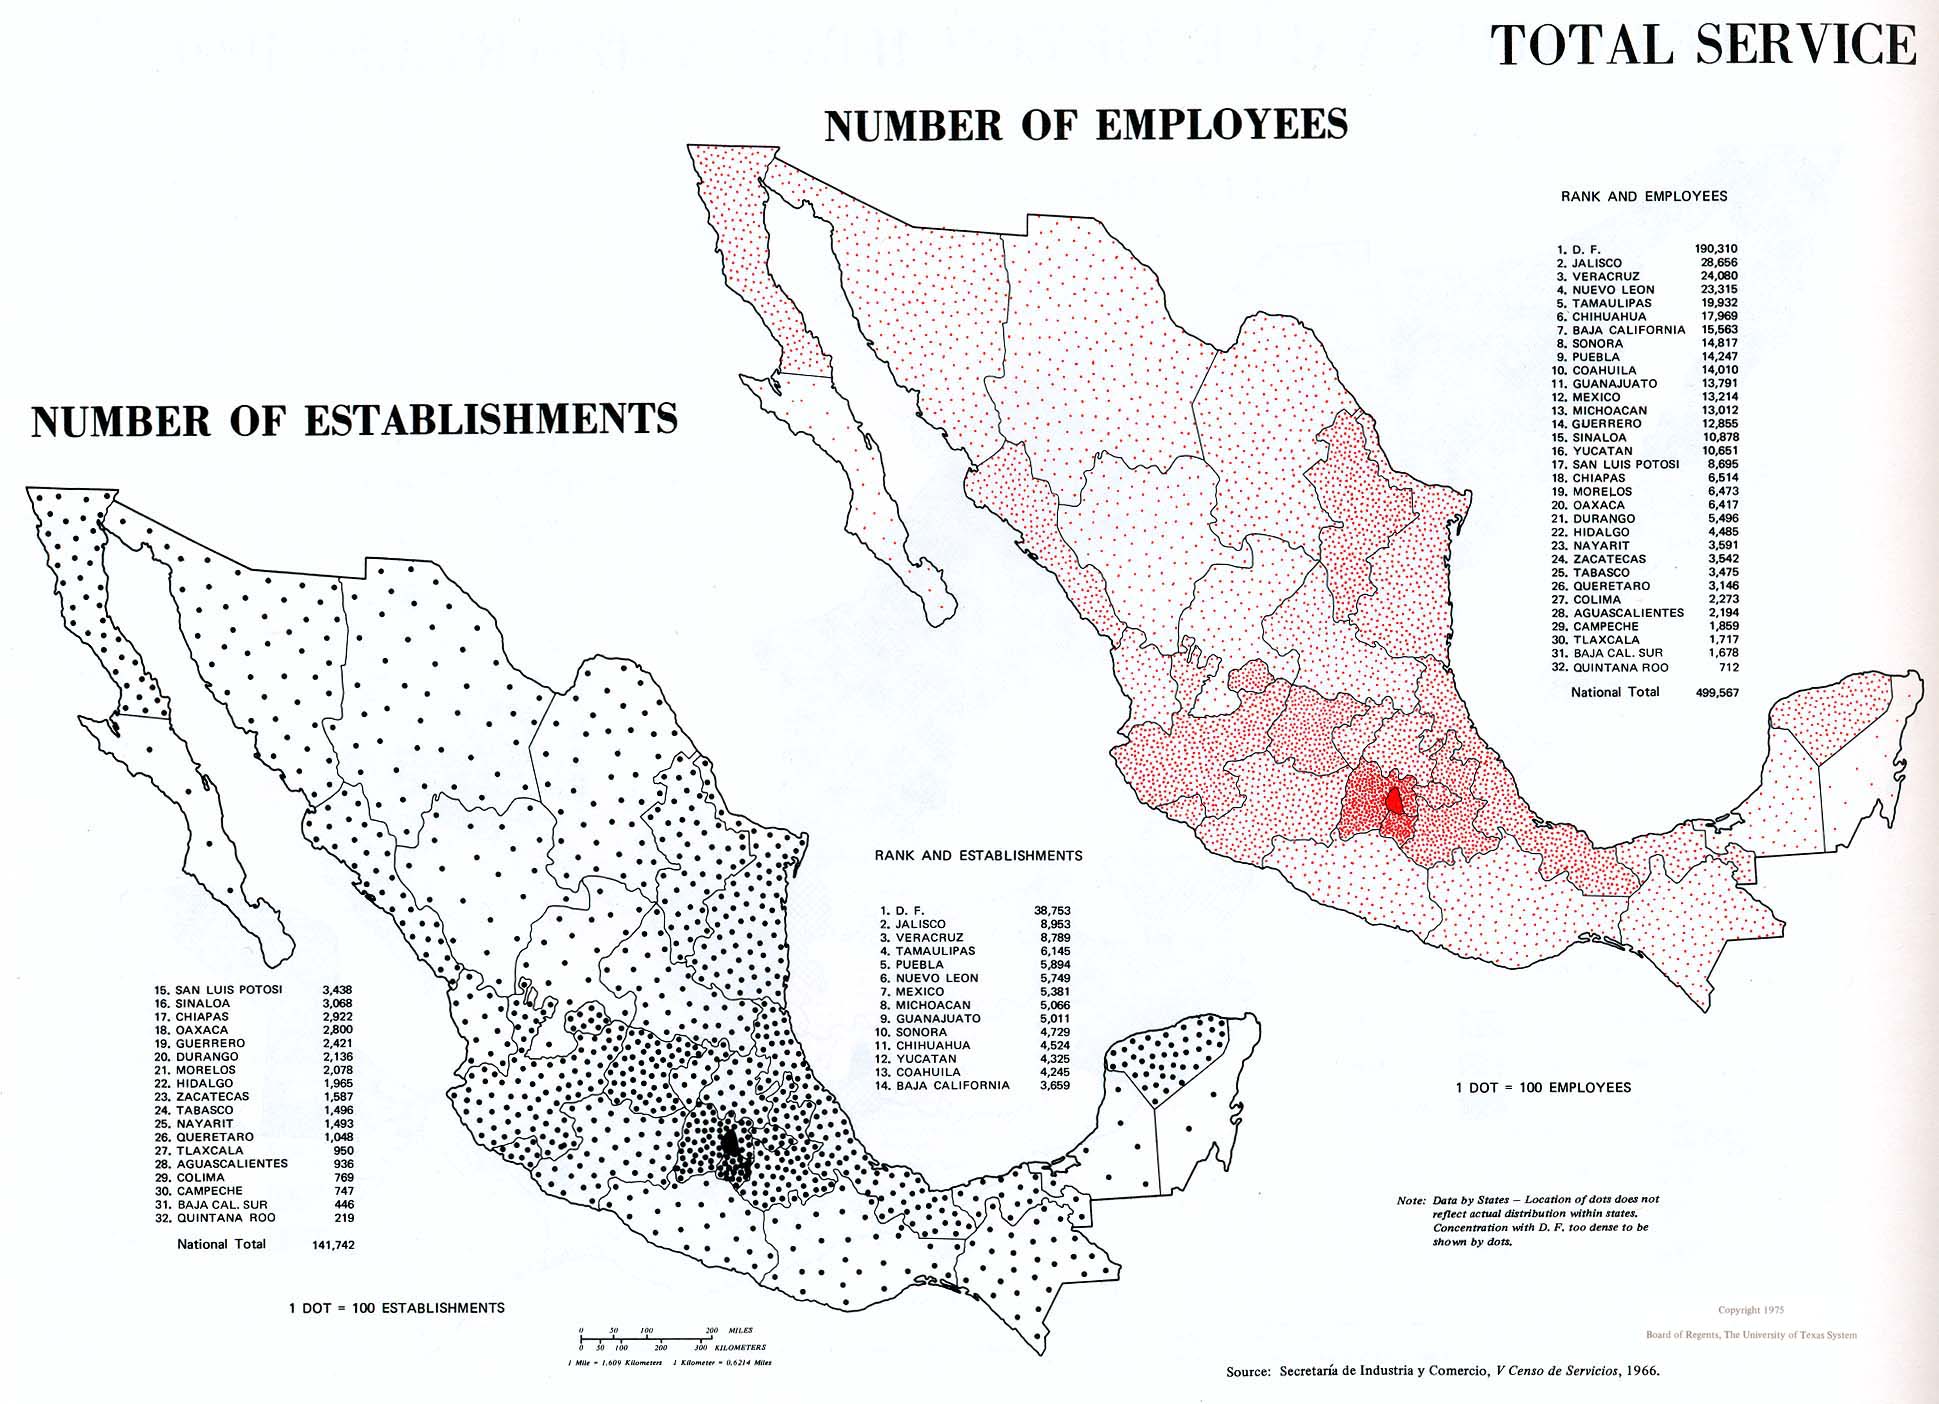
Total Service Activities, 1965: Number of Establishments; Number of Employees (377K)
Total Service Activities, 1965: Total Assets; Value of Services (194K)
Amusement Services, 1965: Number of Establishments; Value of Services (477K)
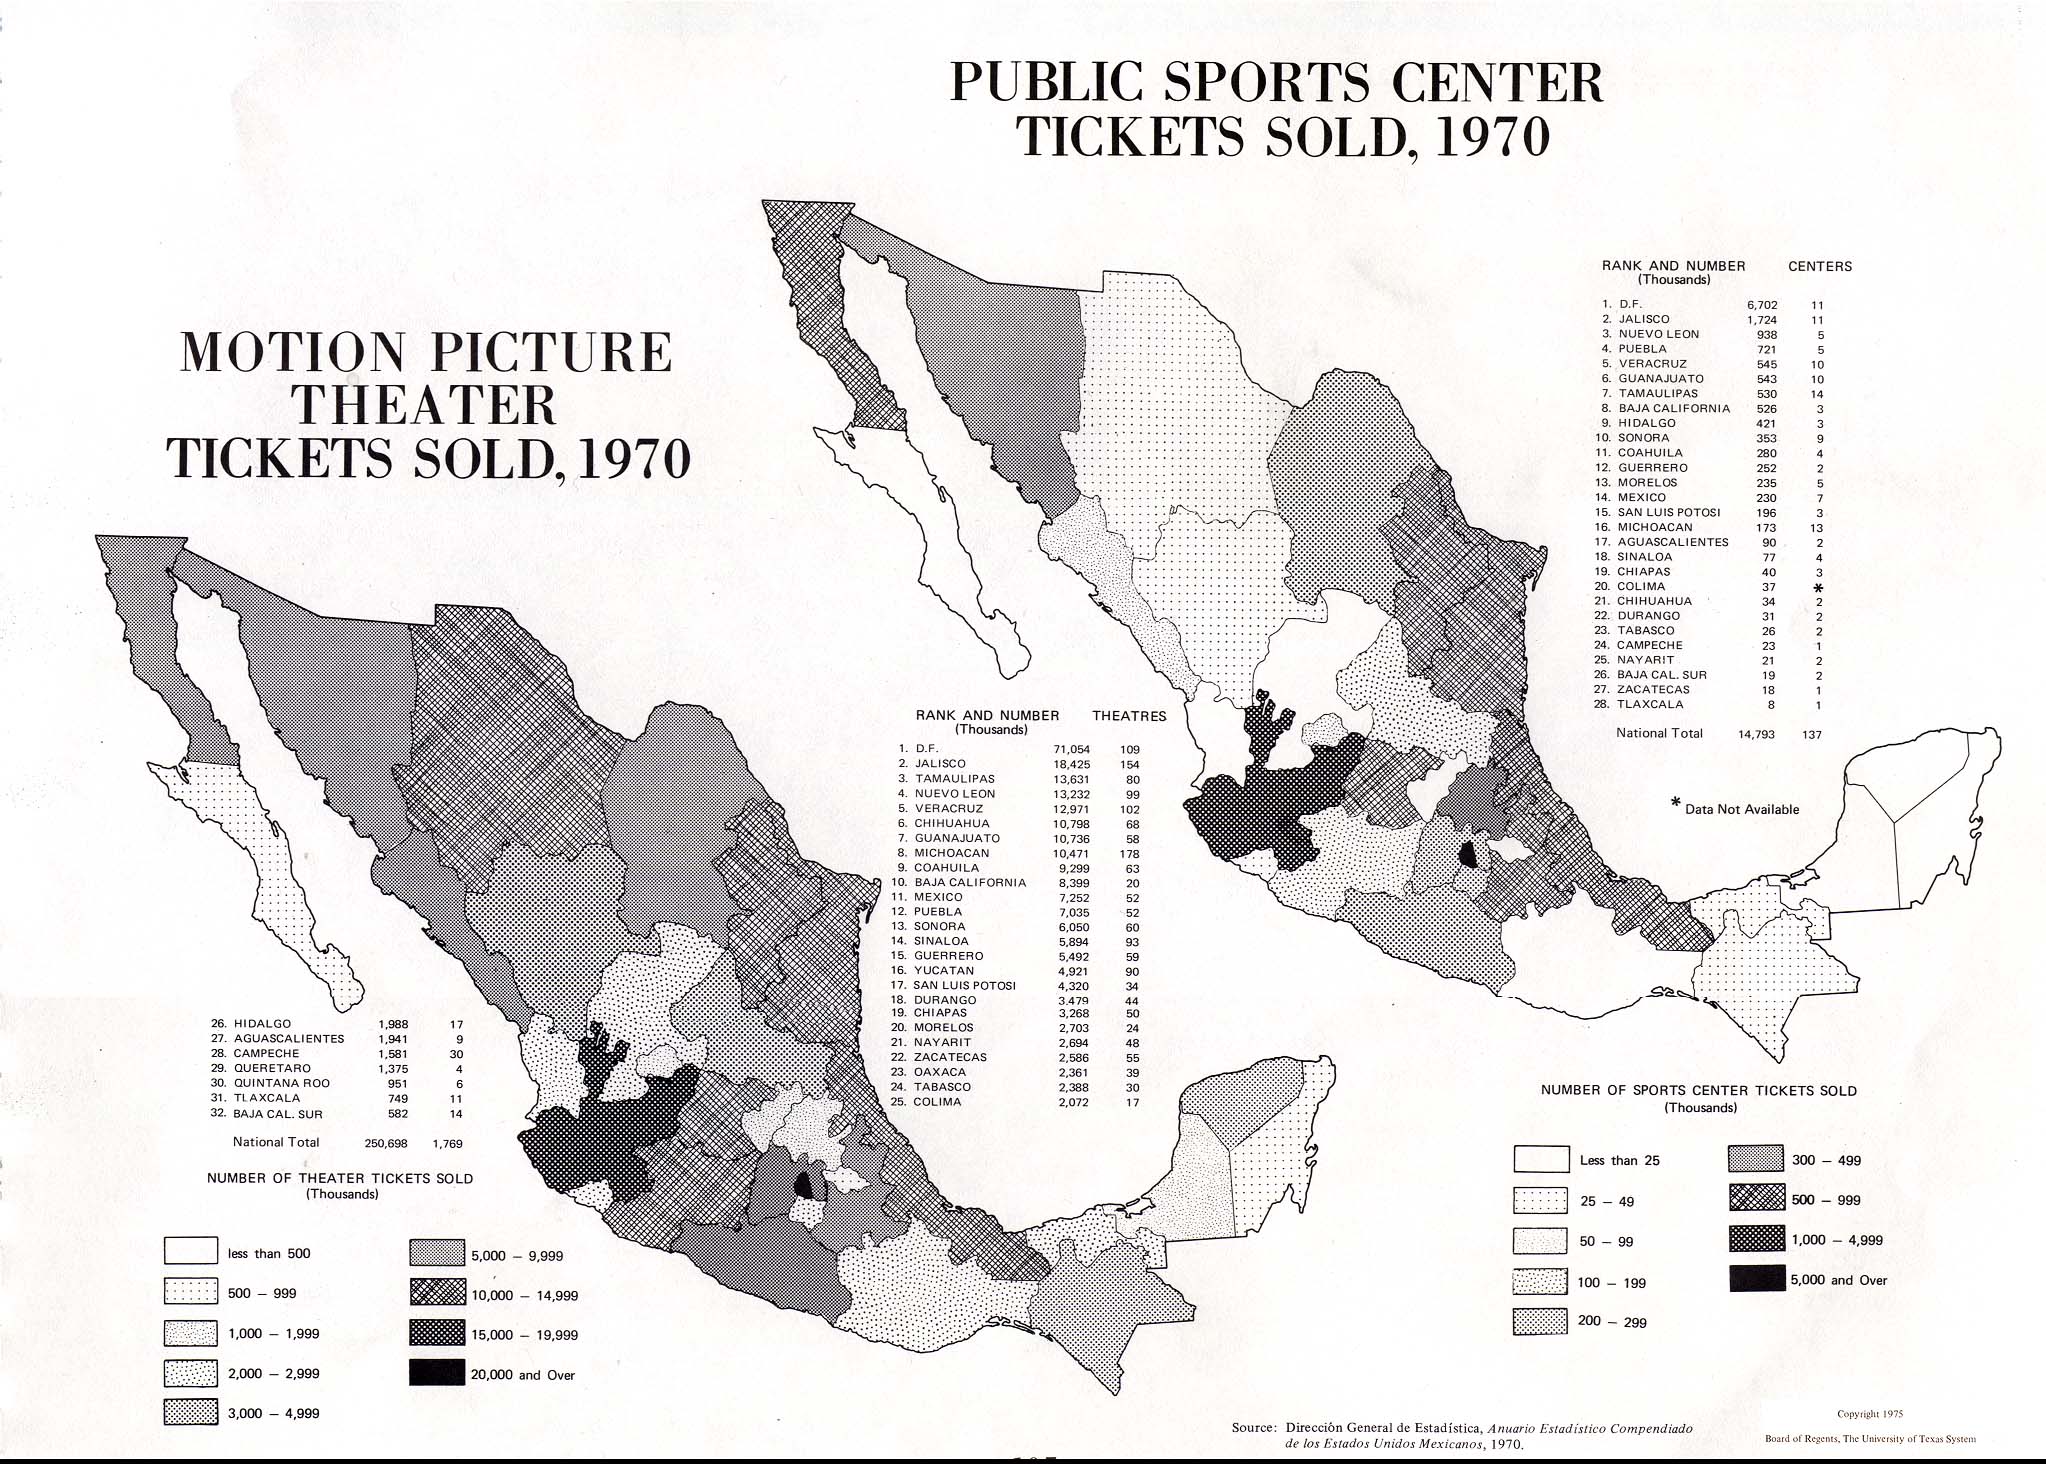
Motion Picture Theater Tickets Sold, 1970; Public Sports Center Tickets Sold, 1970 (538K)
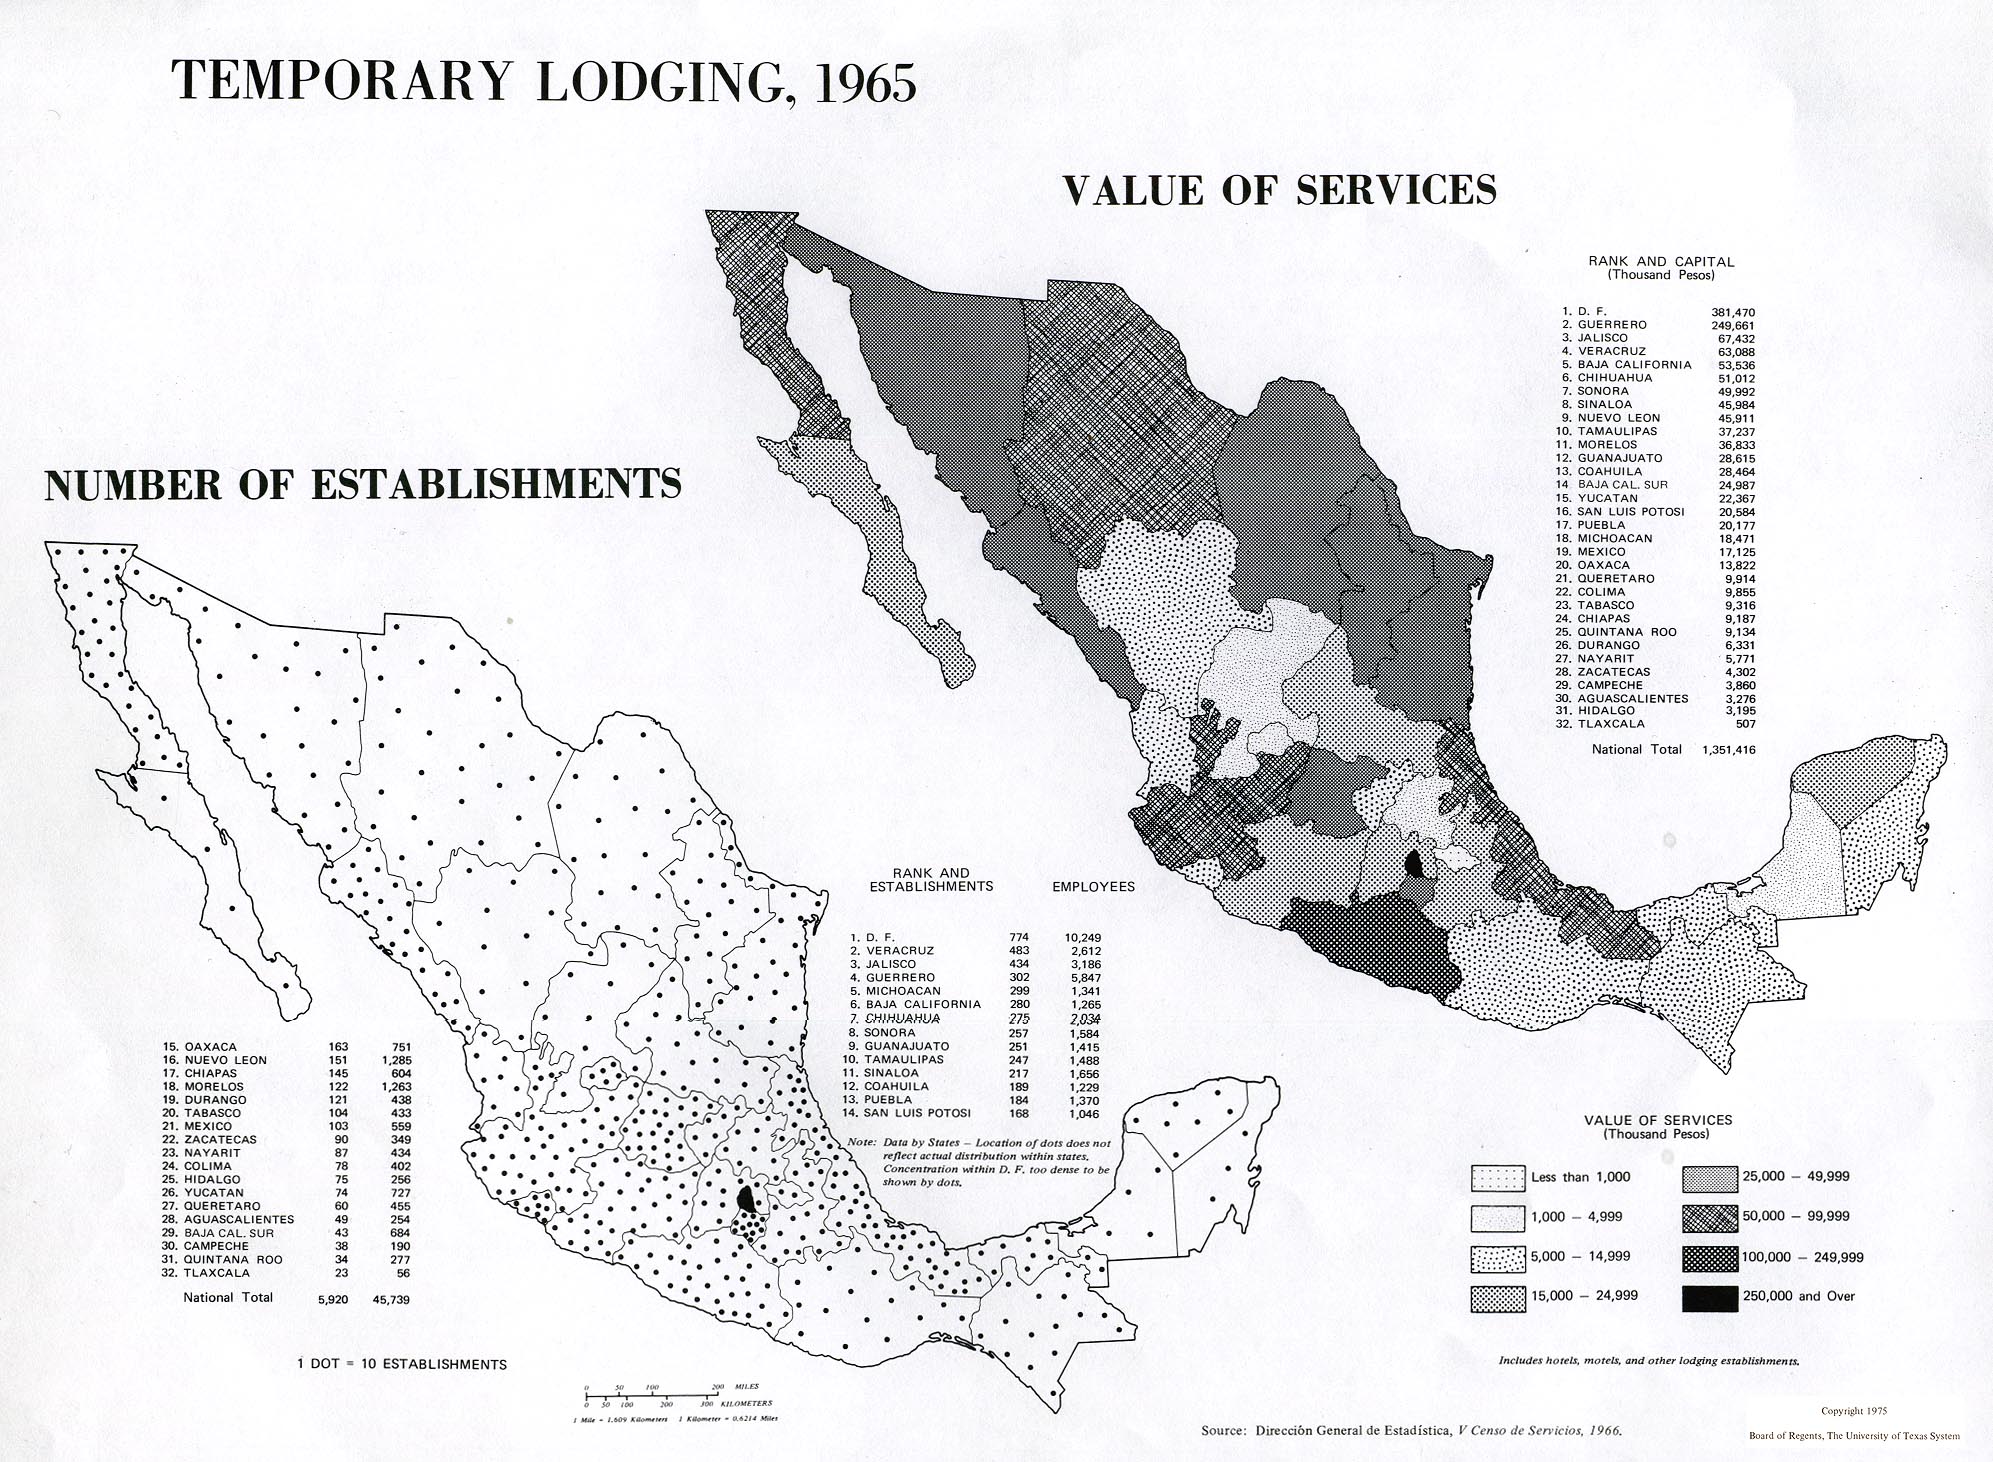
Temporary Lodging, 1965: Number of Establishments; Value of Services (531K)
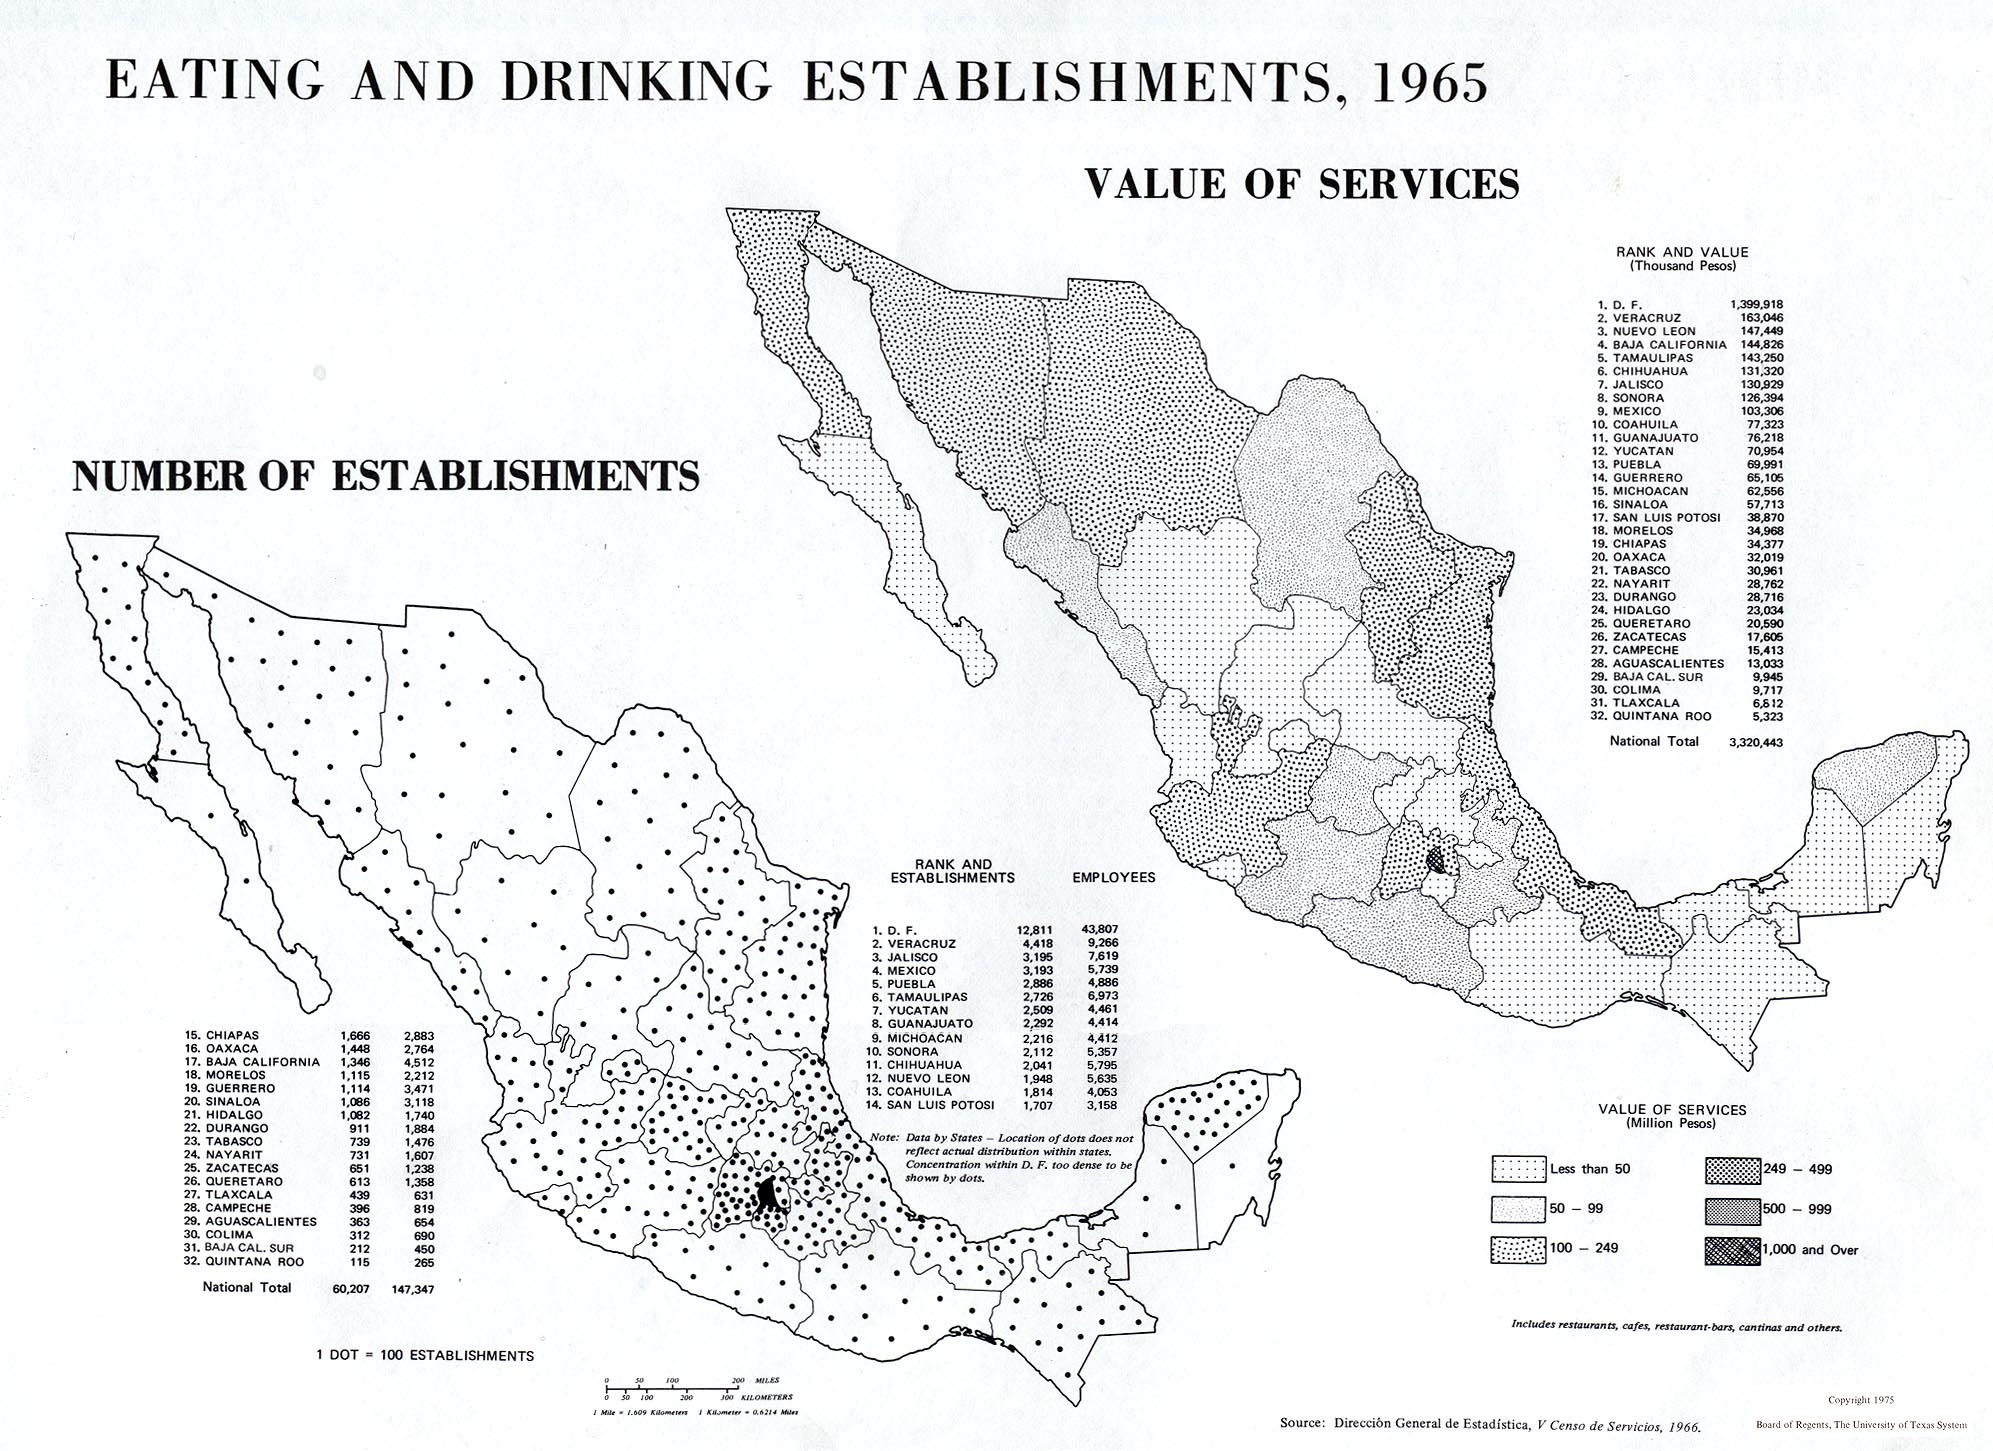
Eating and Drinking Eastablishments, 1965: Number of Establishments; Value of Services (467K)
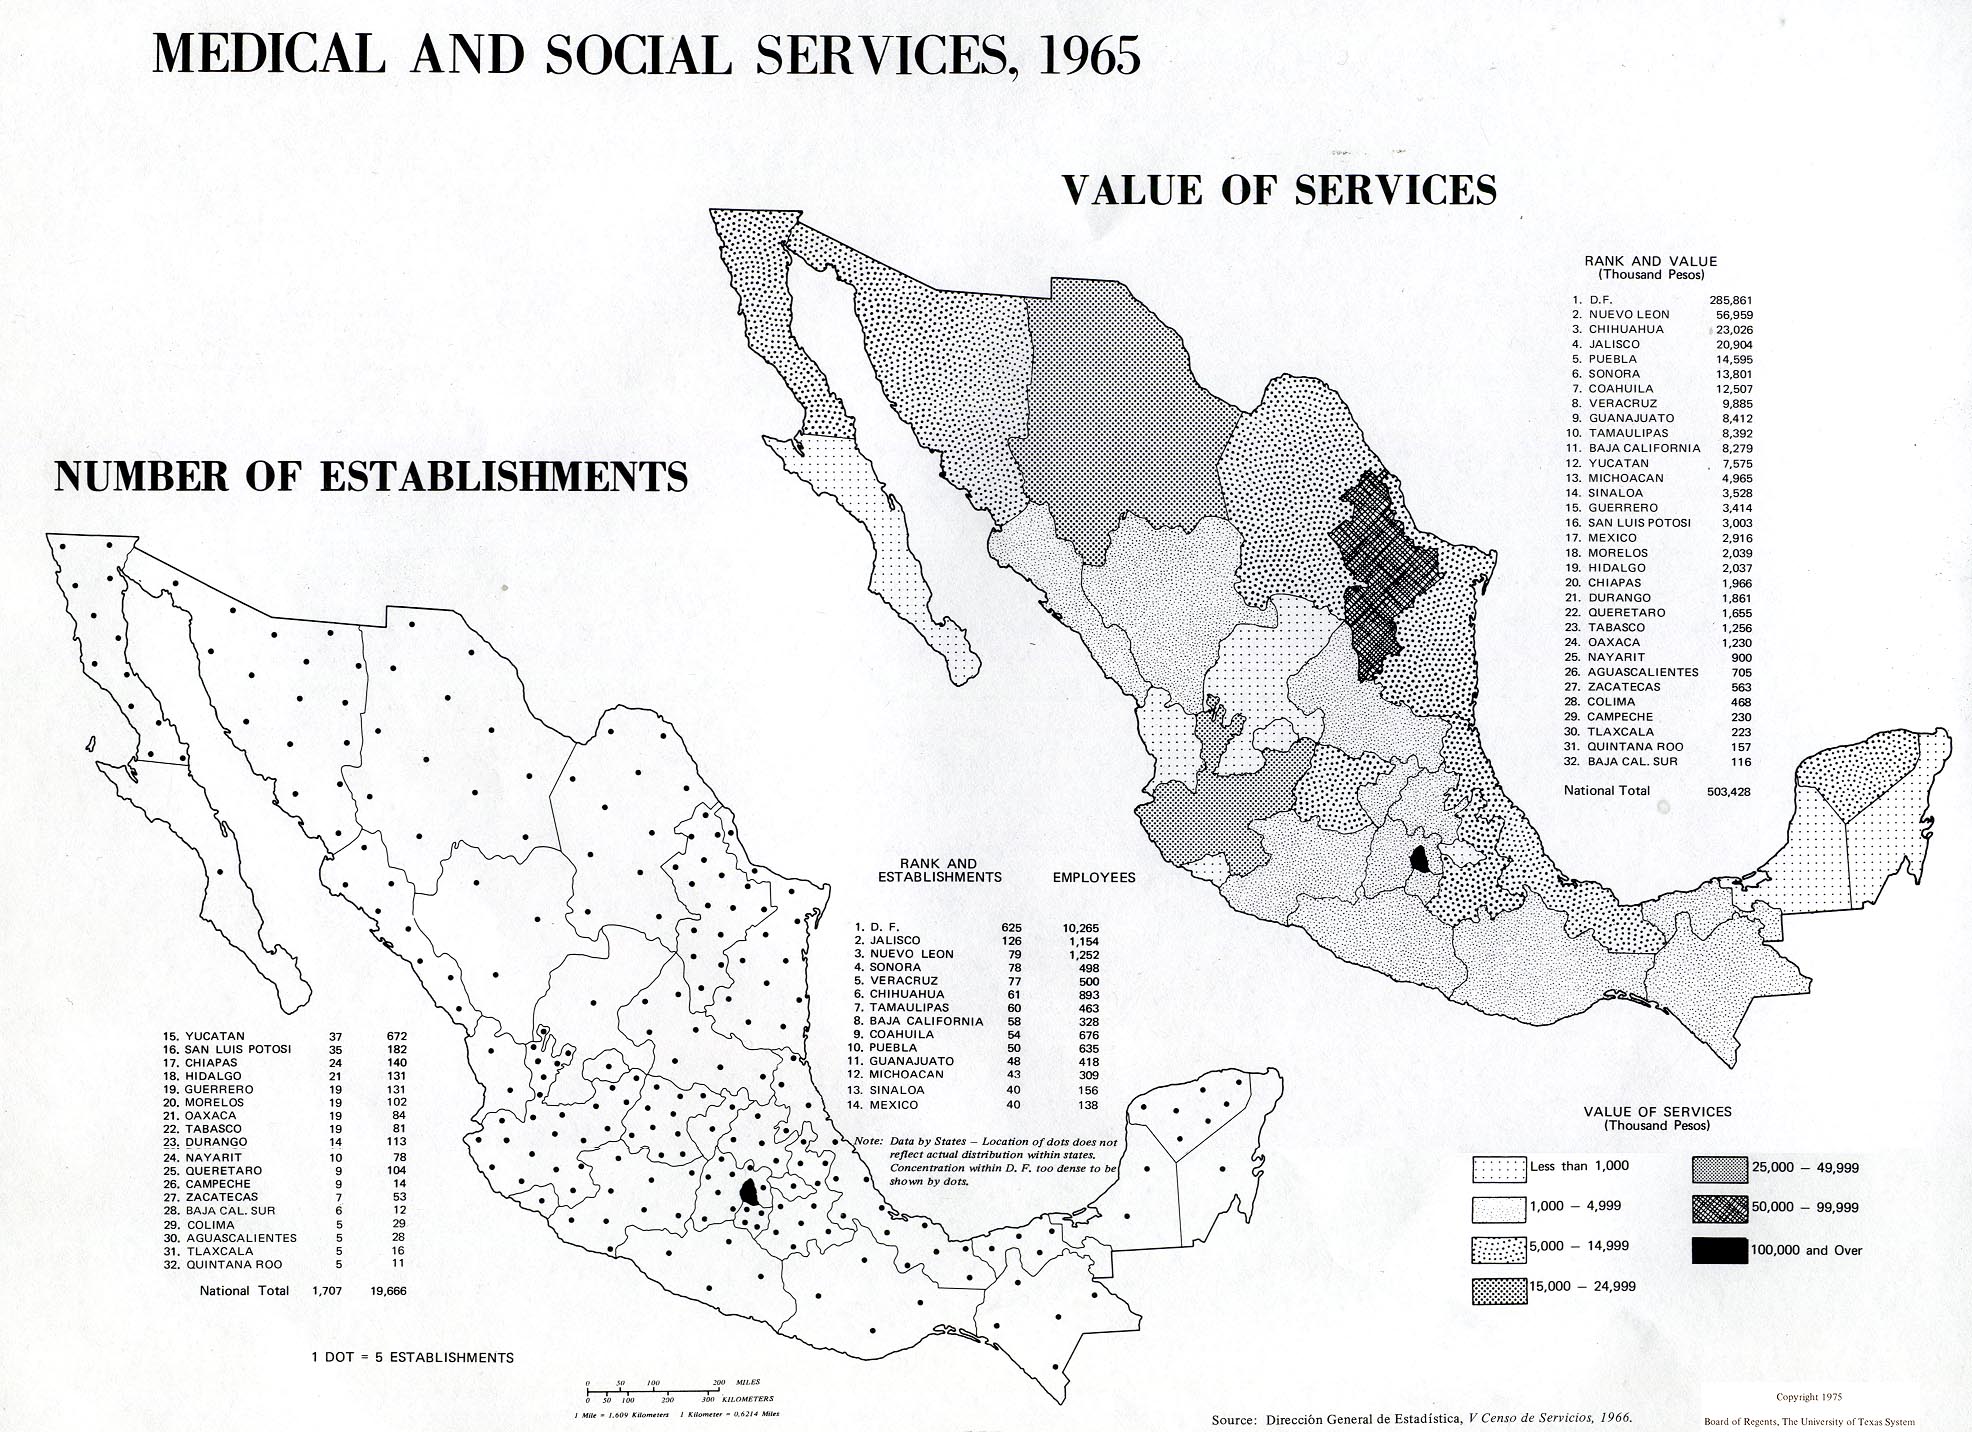
Medical and Social Services, 1965: Number of Establishments; Value of Services (507K)
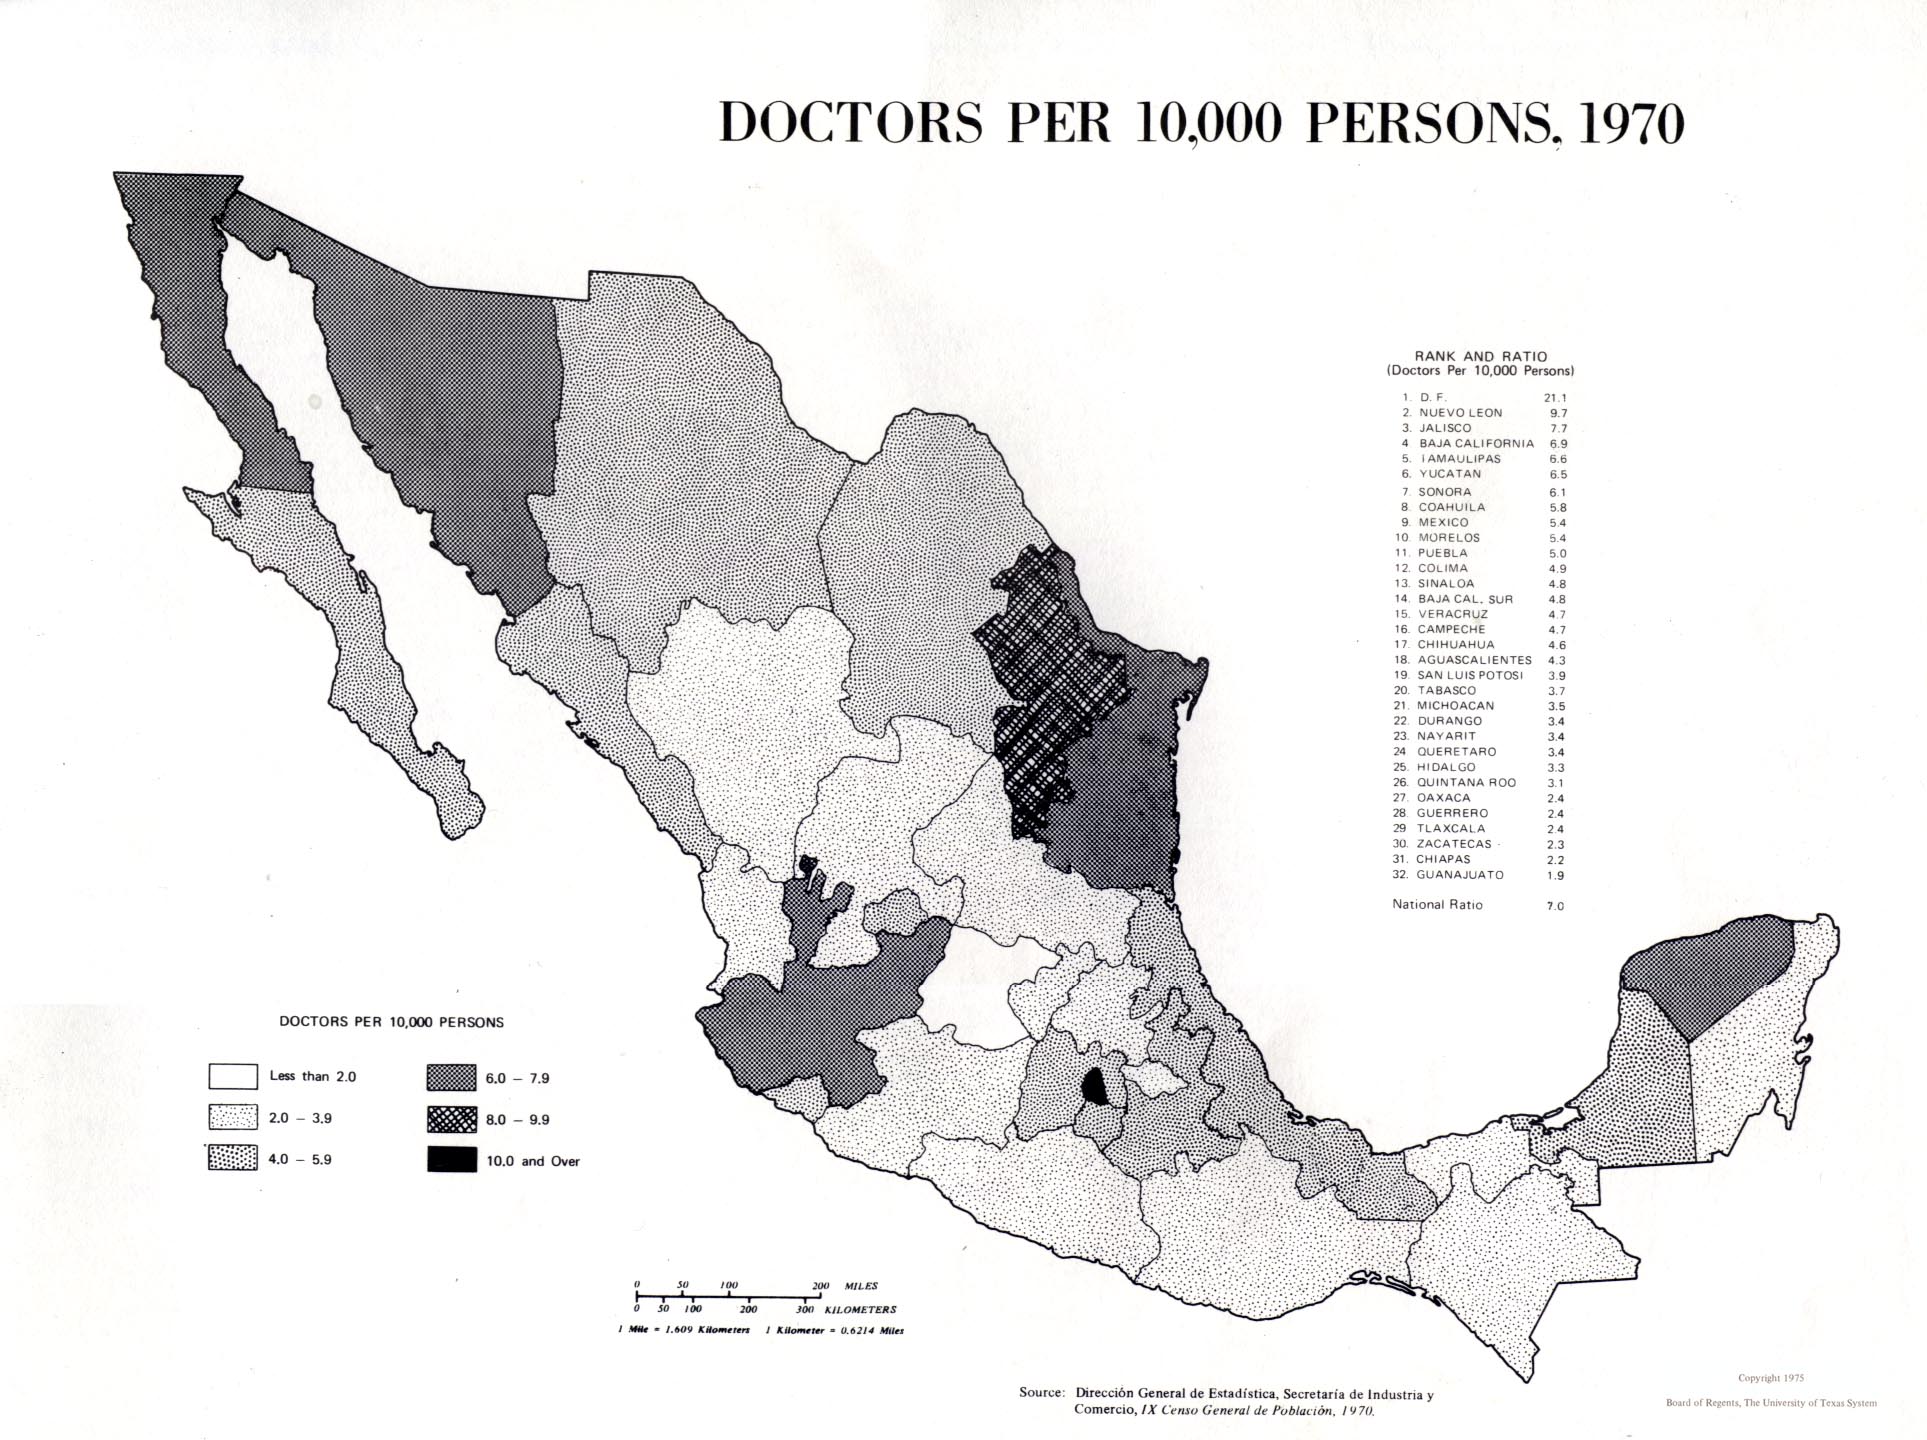
Doctors per 10,000 Persons, 1970 (392K)
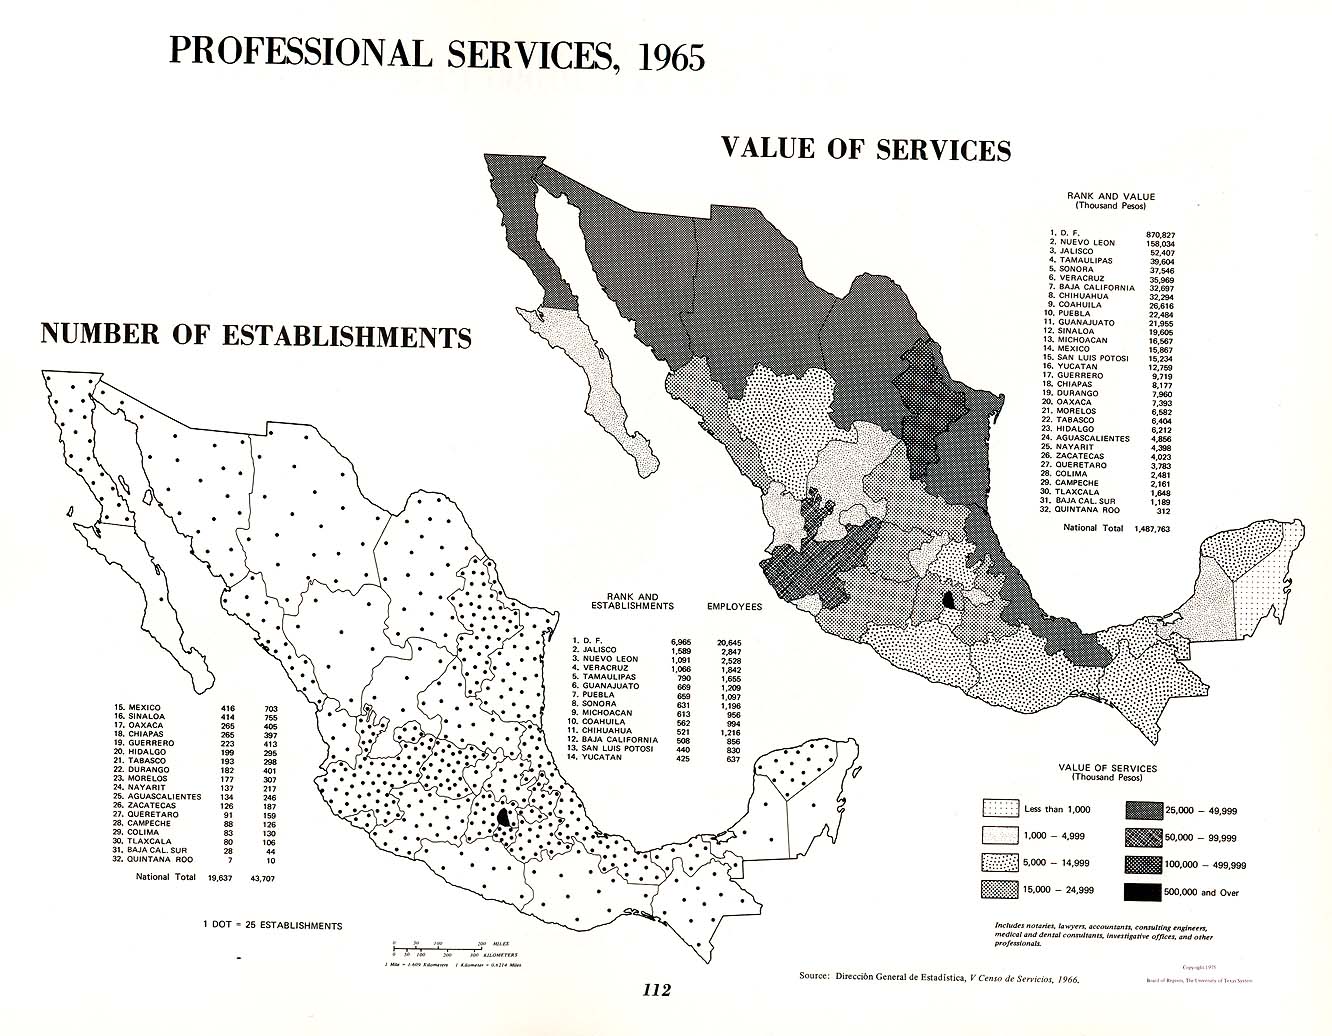
Professional Services, 1965: Number of Establishments; Value of Establishments (257K)
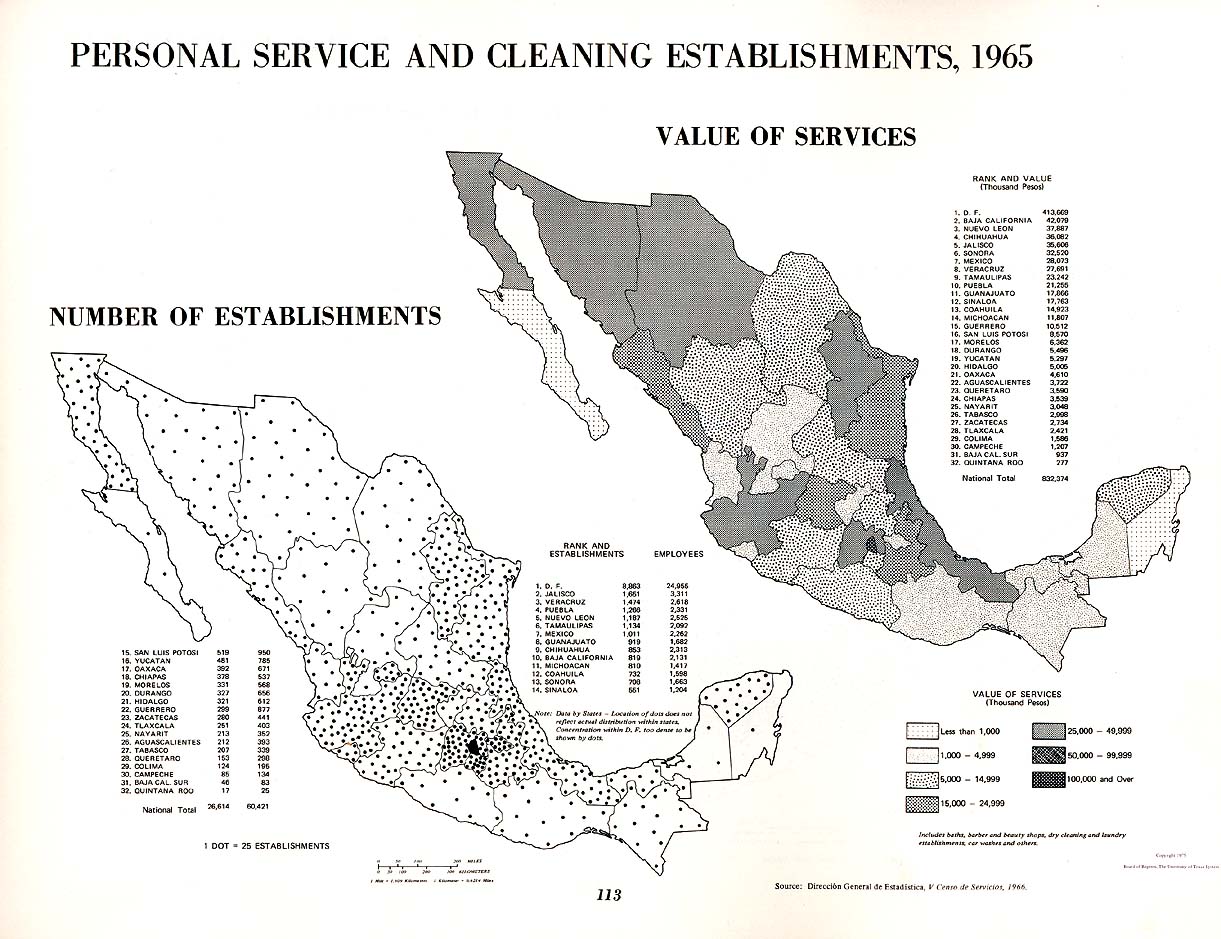
Personal Service and Cleaning Establishments, 1965: Number of Establishments; Value of Services (294K)
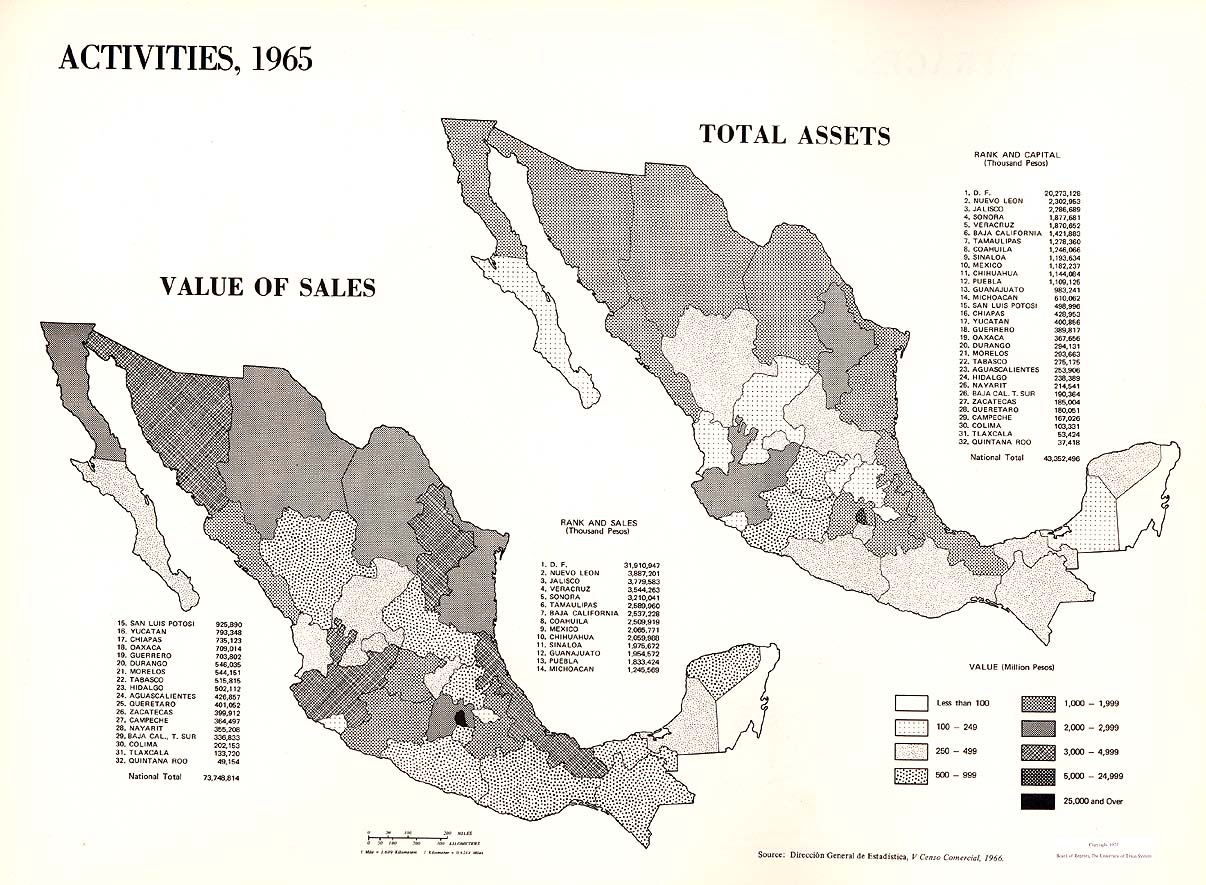
Total Commercial Activities, 1965: Number of Establishments; Number of Employees (211K)
Total Commercial Activities, 1965: Value of Sales; Total Assets (249K)
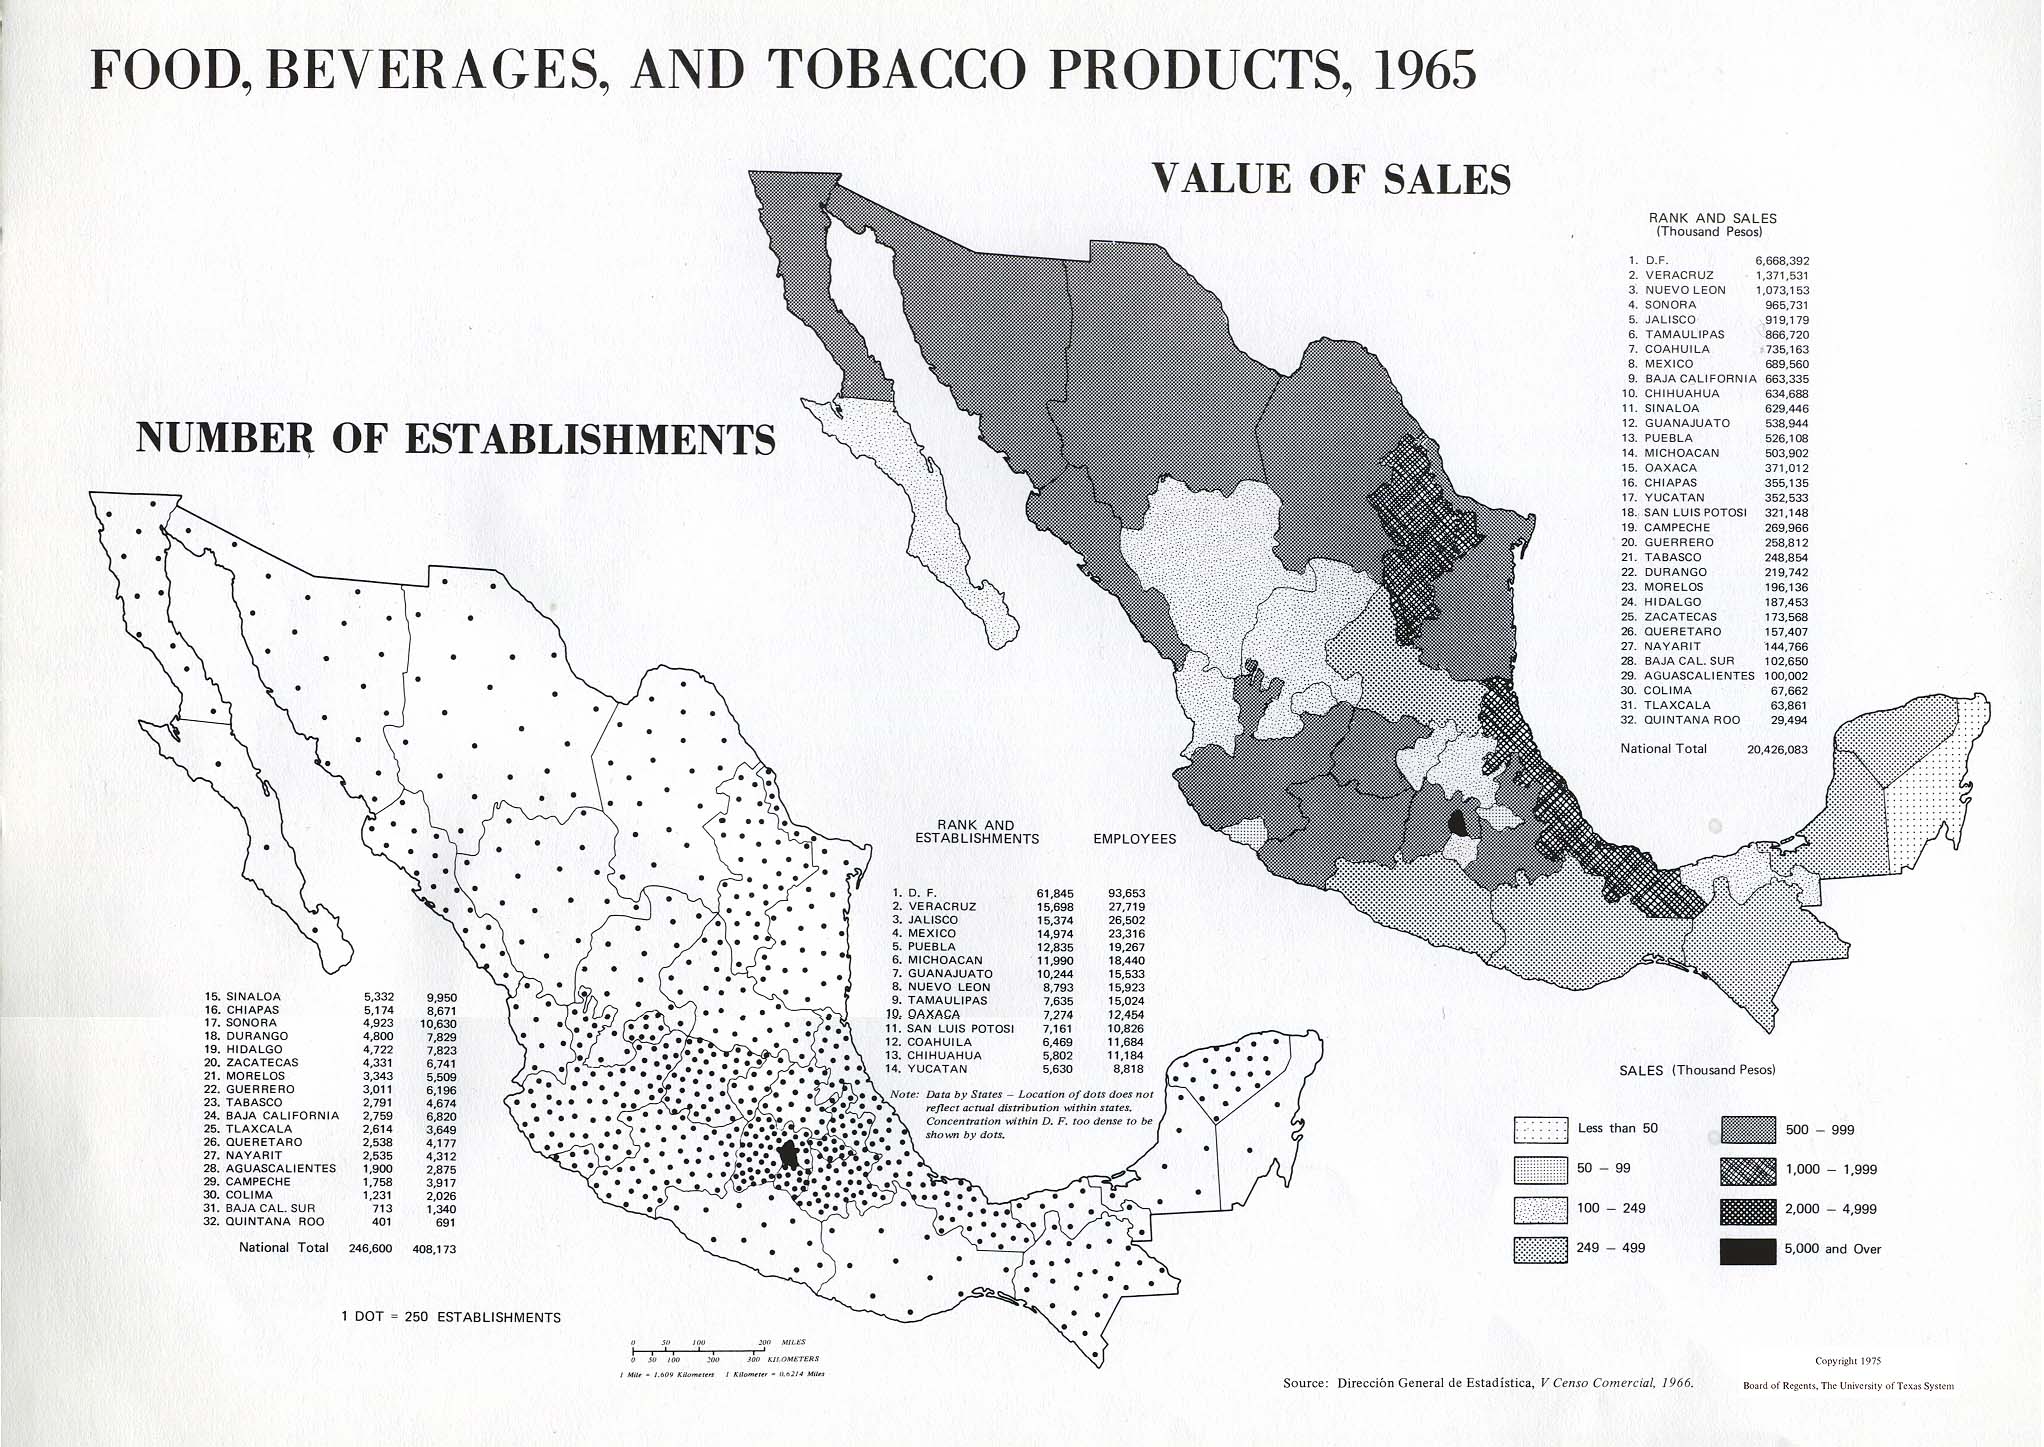
Food, Beverages, and Tobacco Products, 1965: Number of Establishments; Value of Sales (471K)
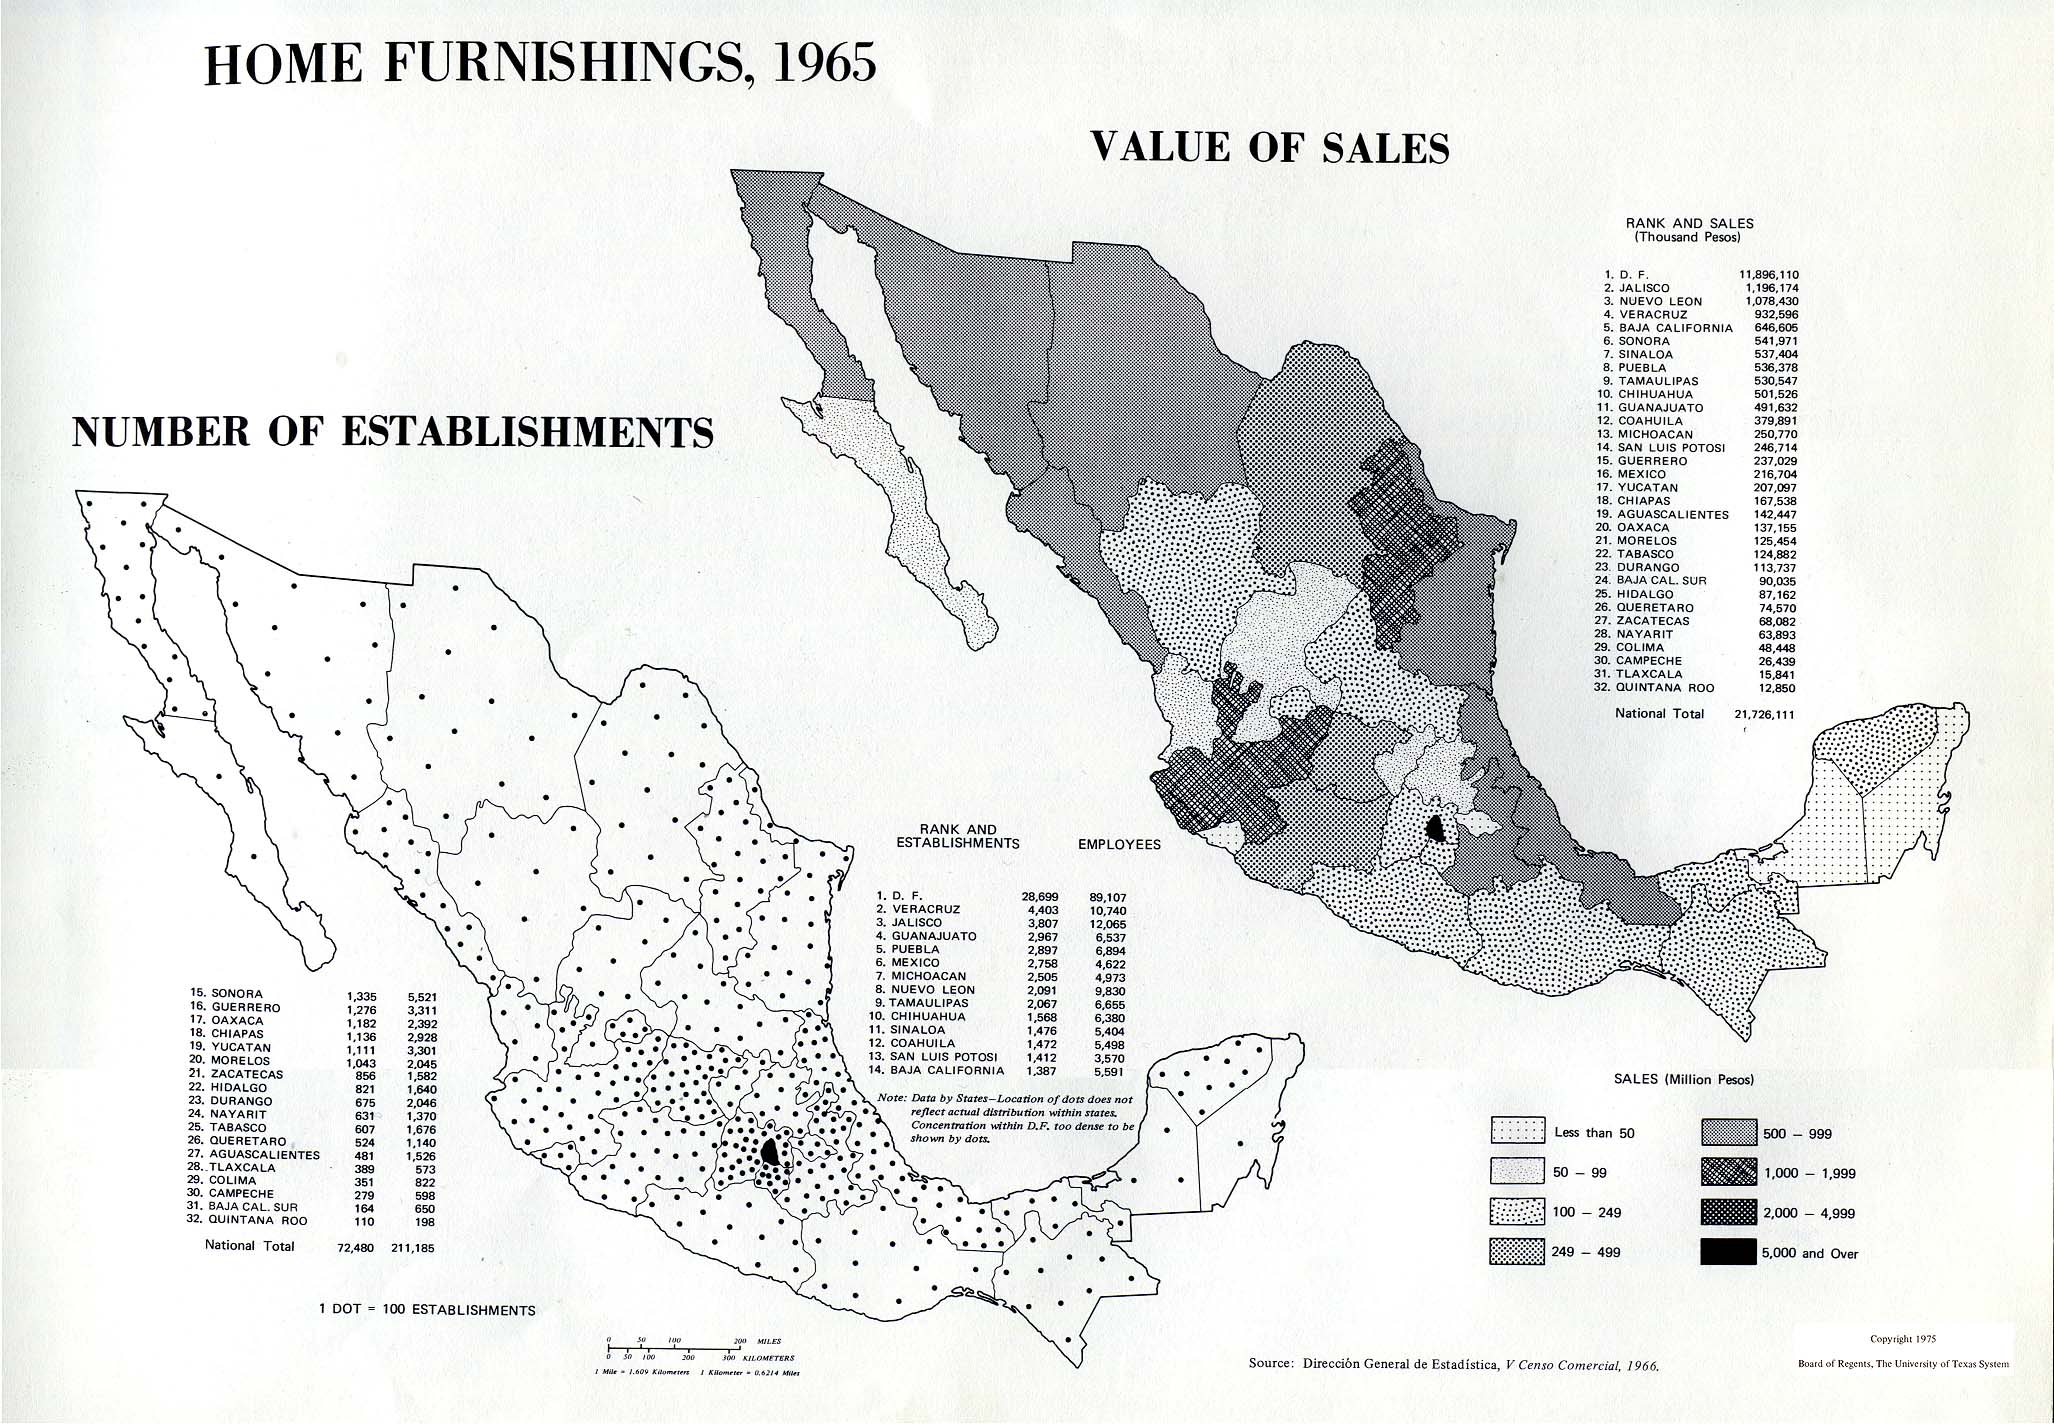
Home Furnishings, 1965: Number of Establishments; Value of Sales (481K)
Construction Materials, 1965: Number of Establishments; Value of Sales (430K)
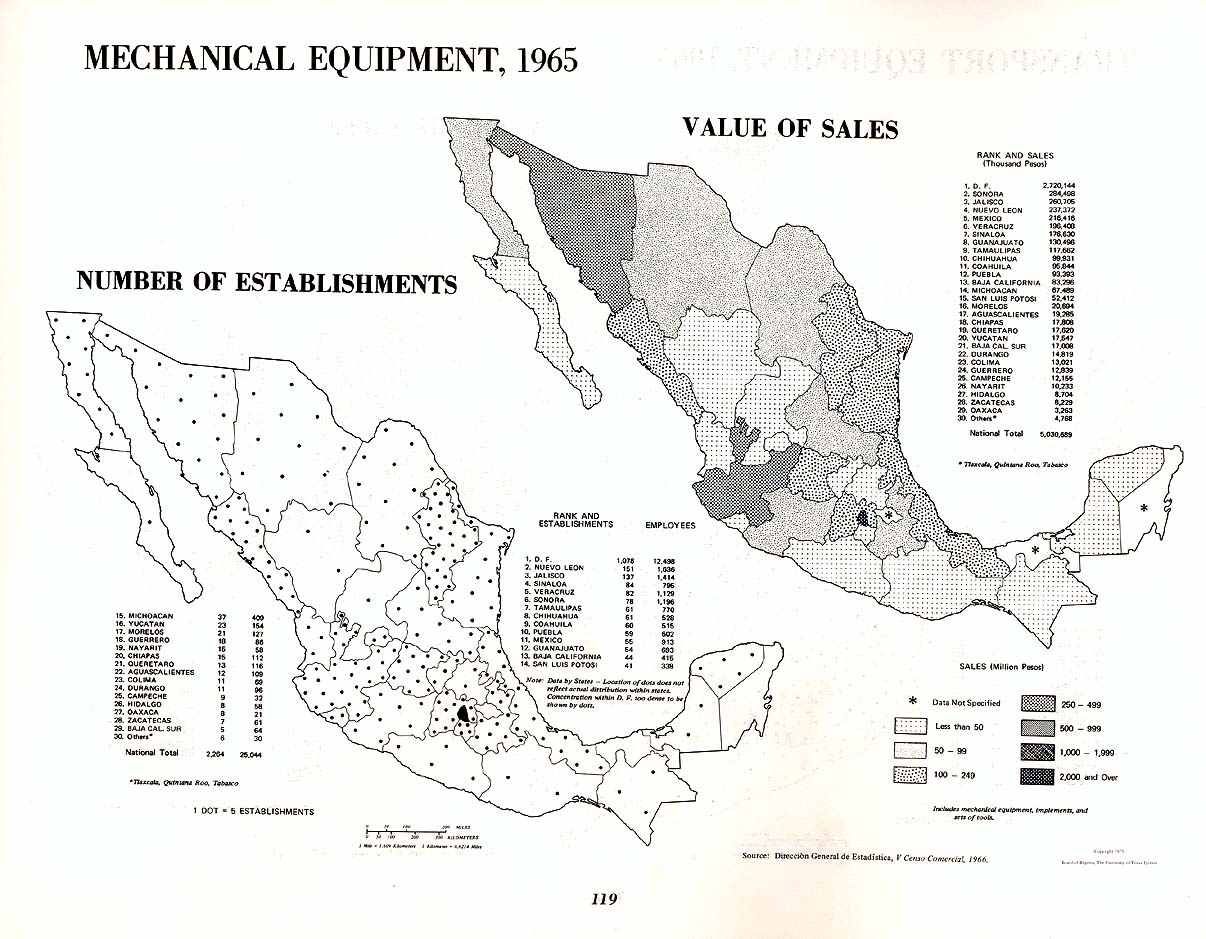
Mechanical Equipment, 1965: Number of Establishments; Value of Sales (232K)
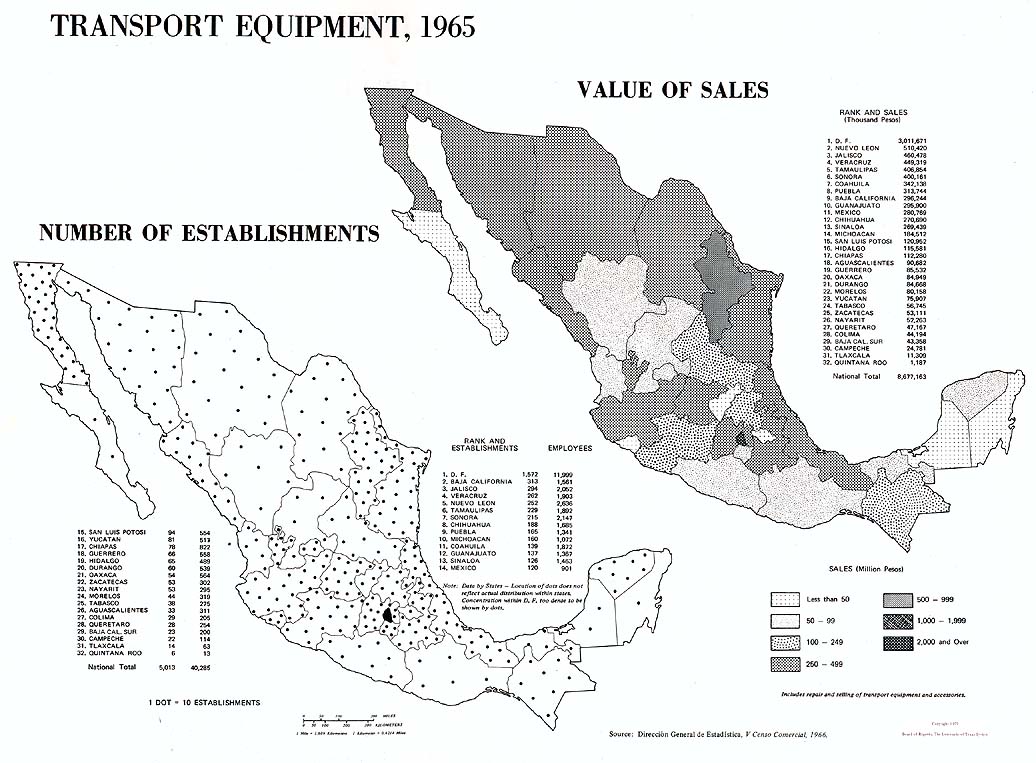
Transport Equipment, 1965: Number of Establishments; Value of Sales (188K)
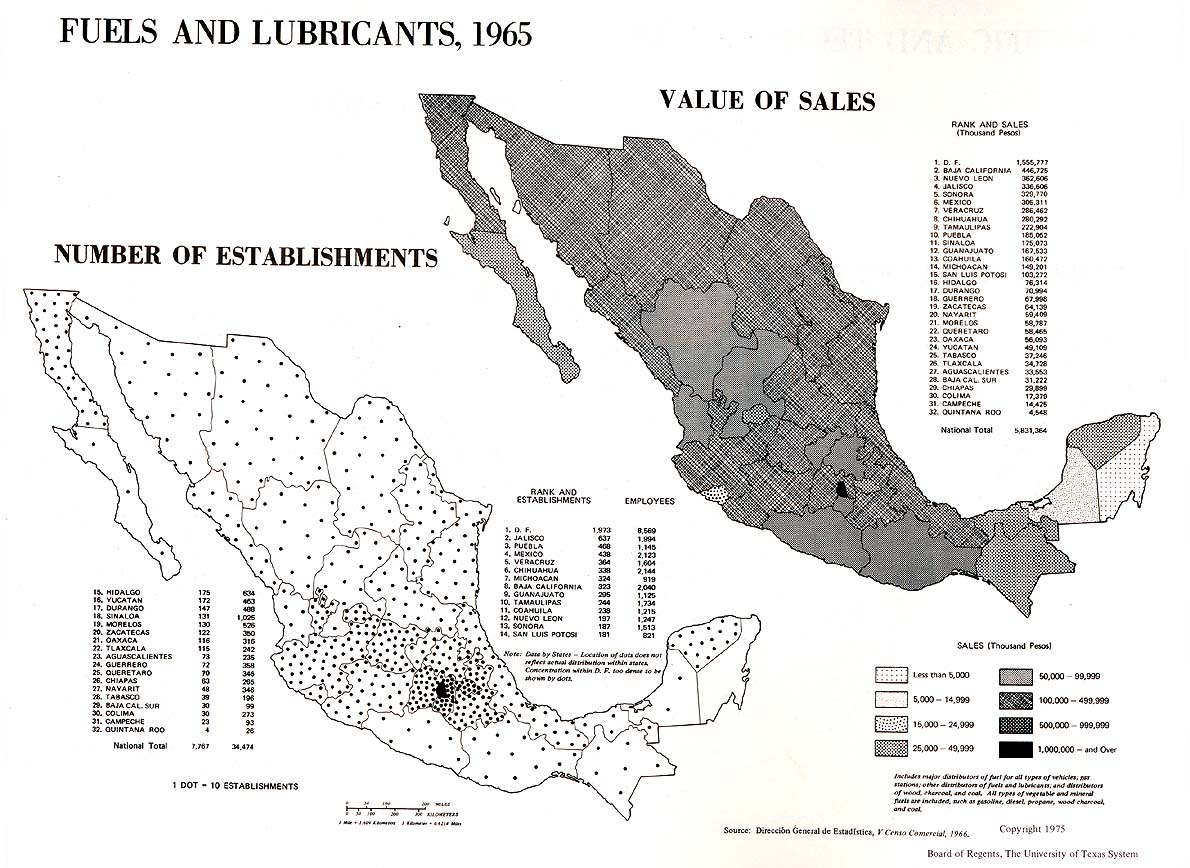
Fuels and Lubricants, 1965: Number of Establishments; Value of Sales (249K)
Scientific and Technical Apparatus, 1965: Number of Establishments; Value of Sales (184K)
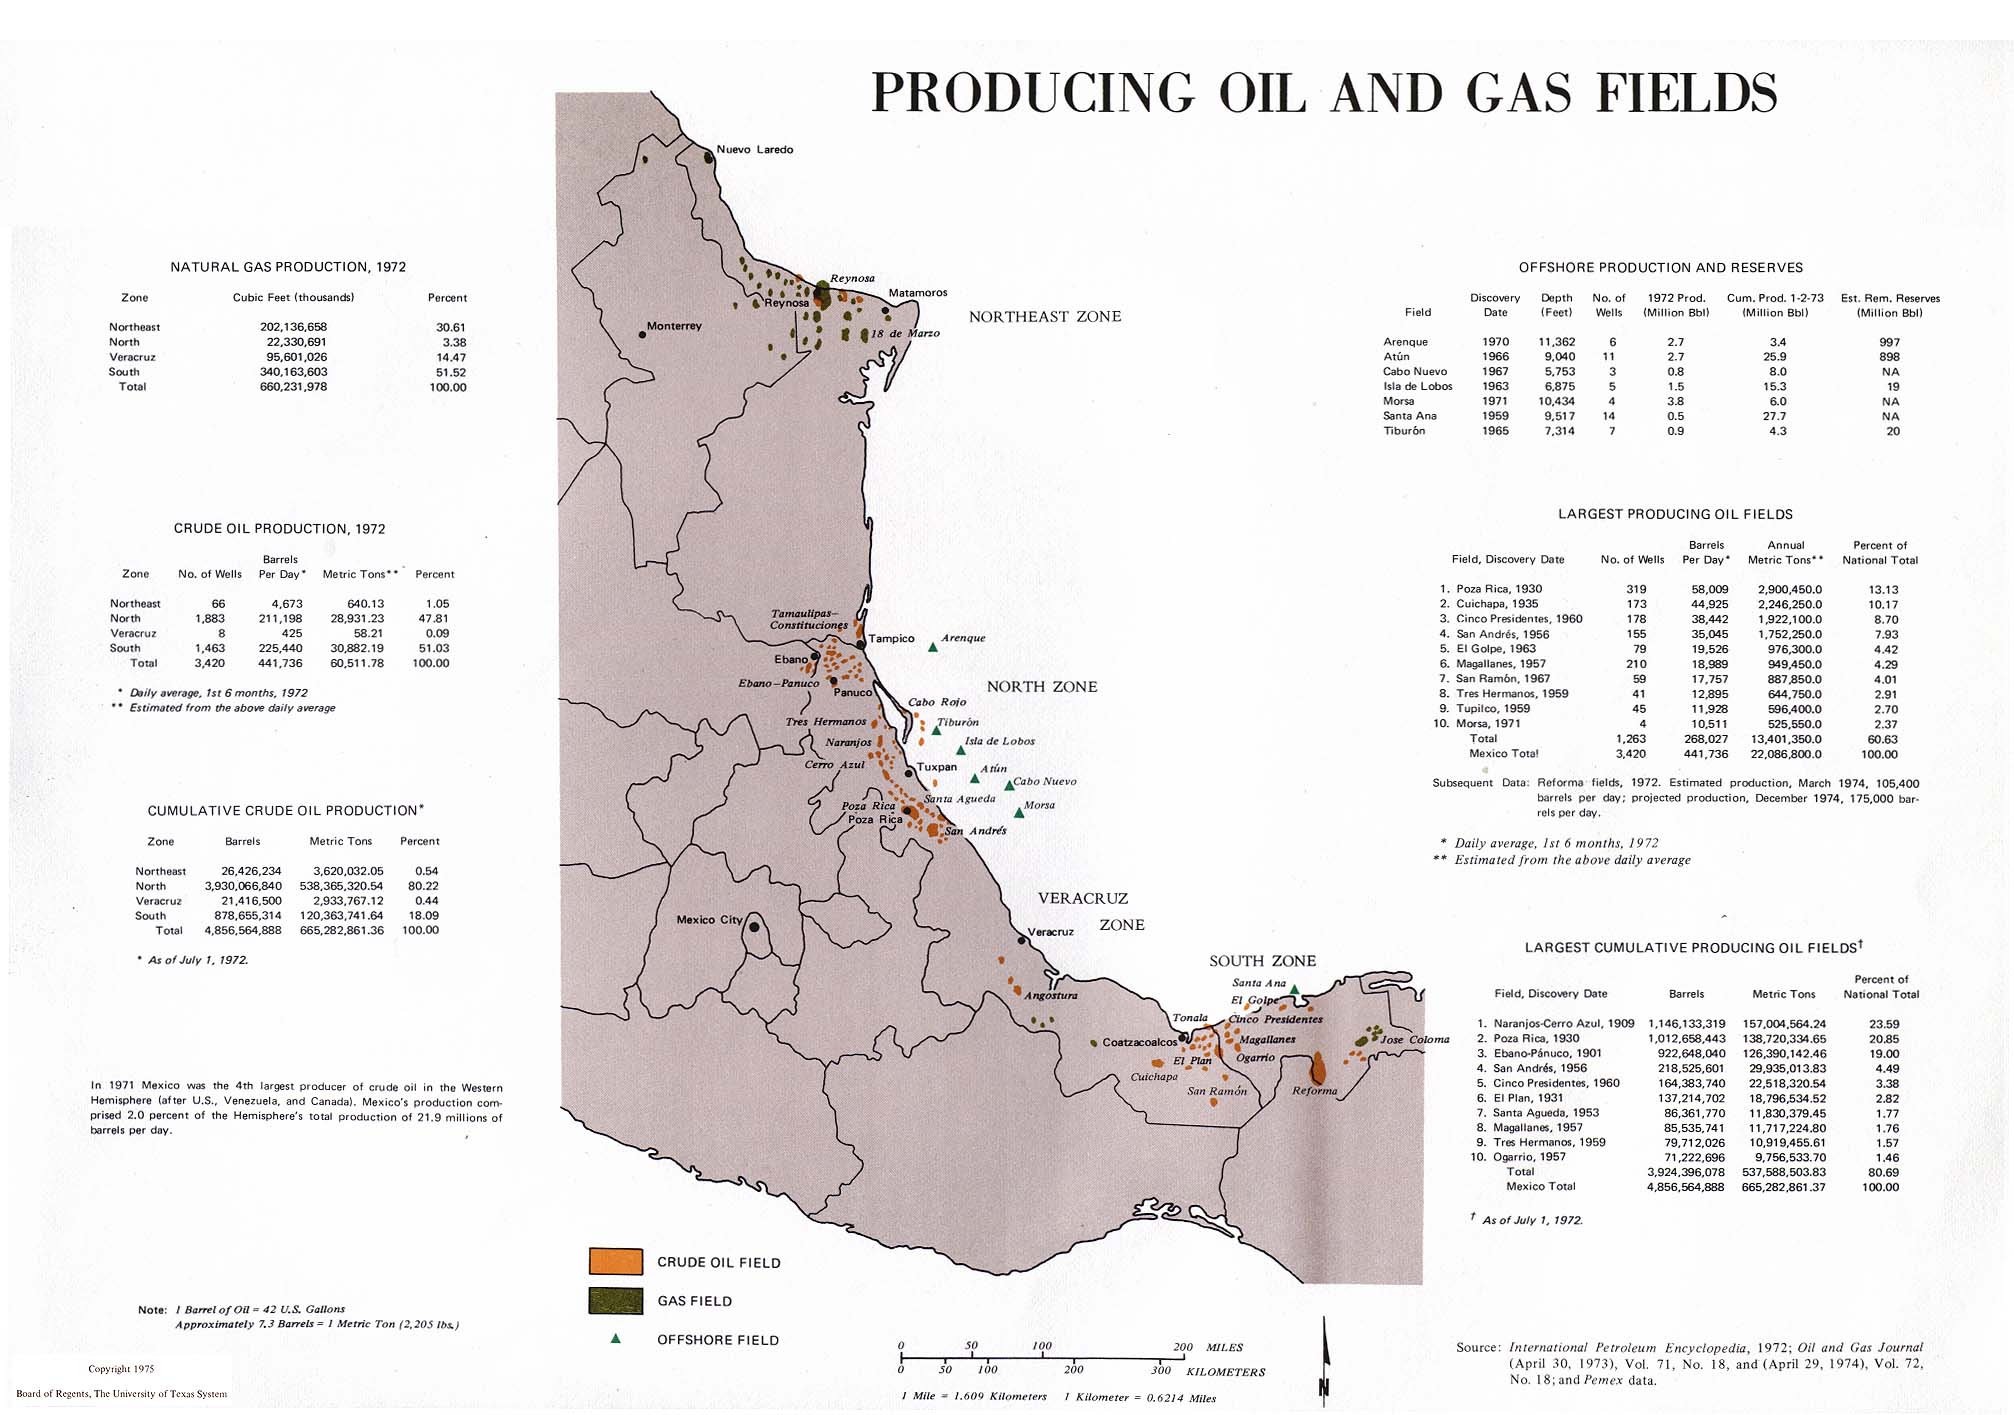
Producing Oil and Gas Fields (287K)
Petroleum Pipelines and Processing Facilities (216K)
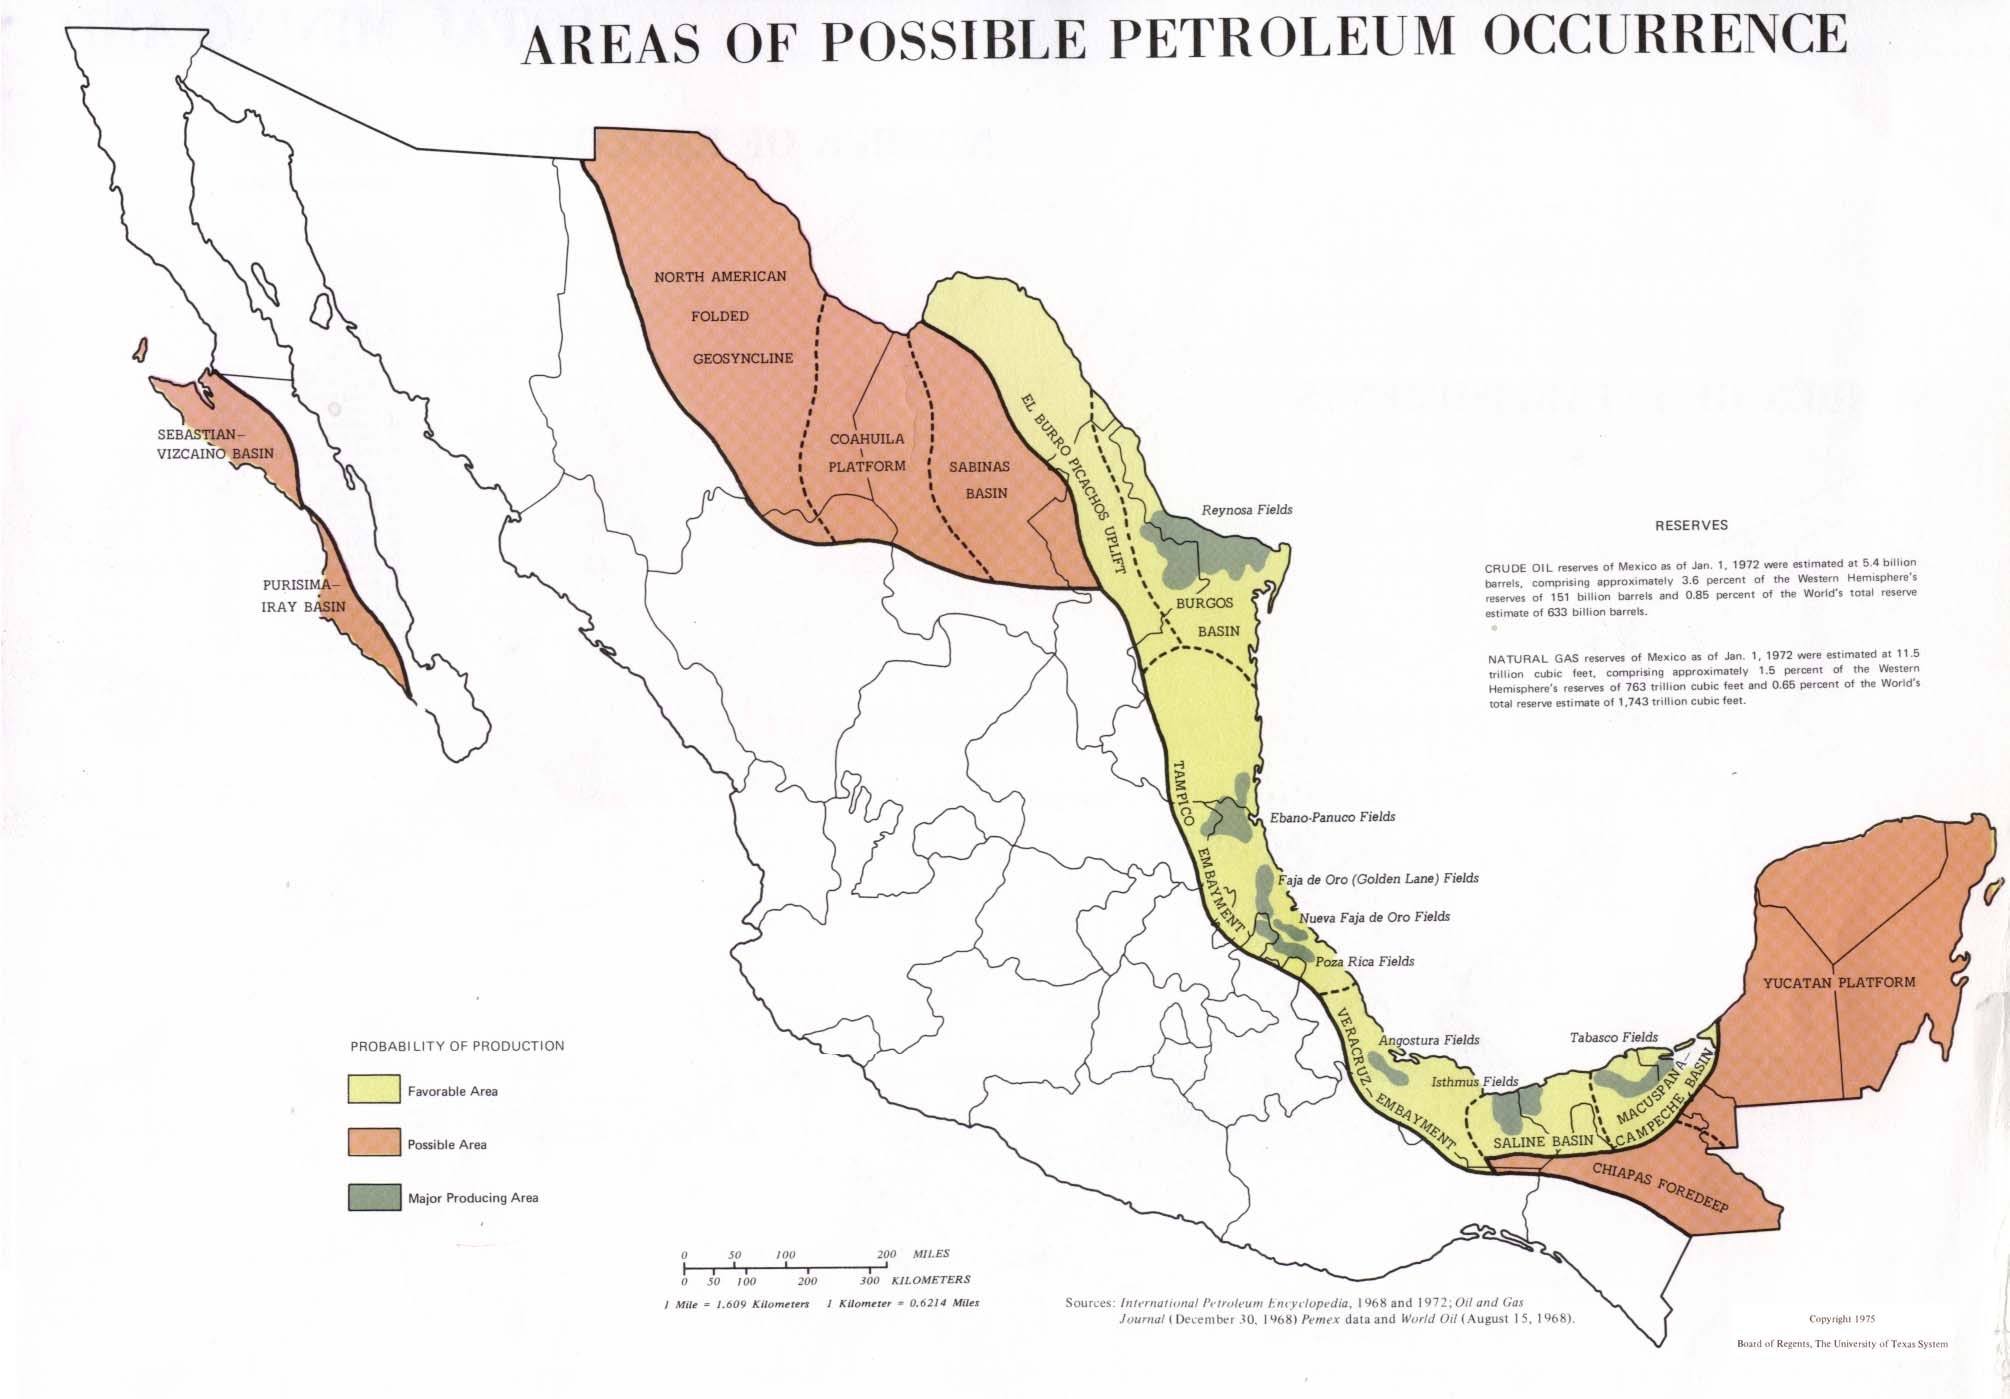
Areas of Possible Petroleum Occurrence (178K)
Total Mining and Manufacturing Activities, 1965: Number of Establishments; Number of Employees (178K)
Total Mining and Manufacturing Activities, 1965: Value of Production, Value of Capital (178K)
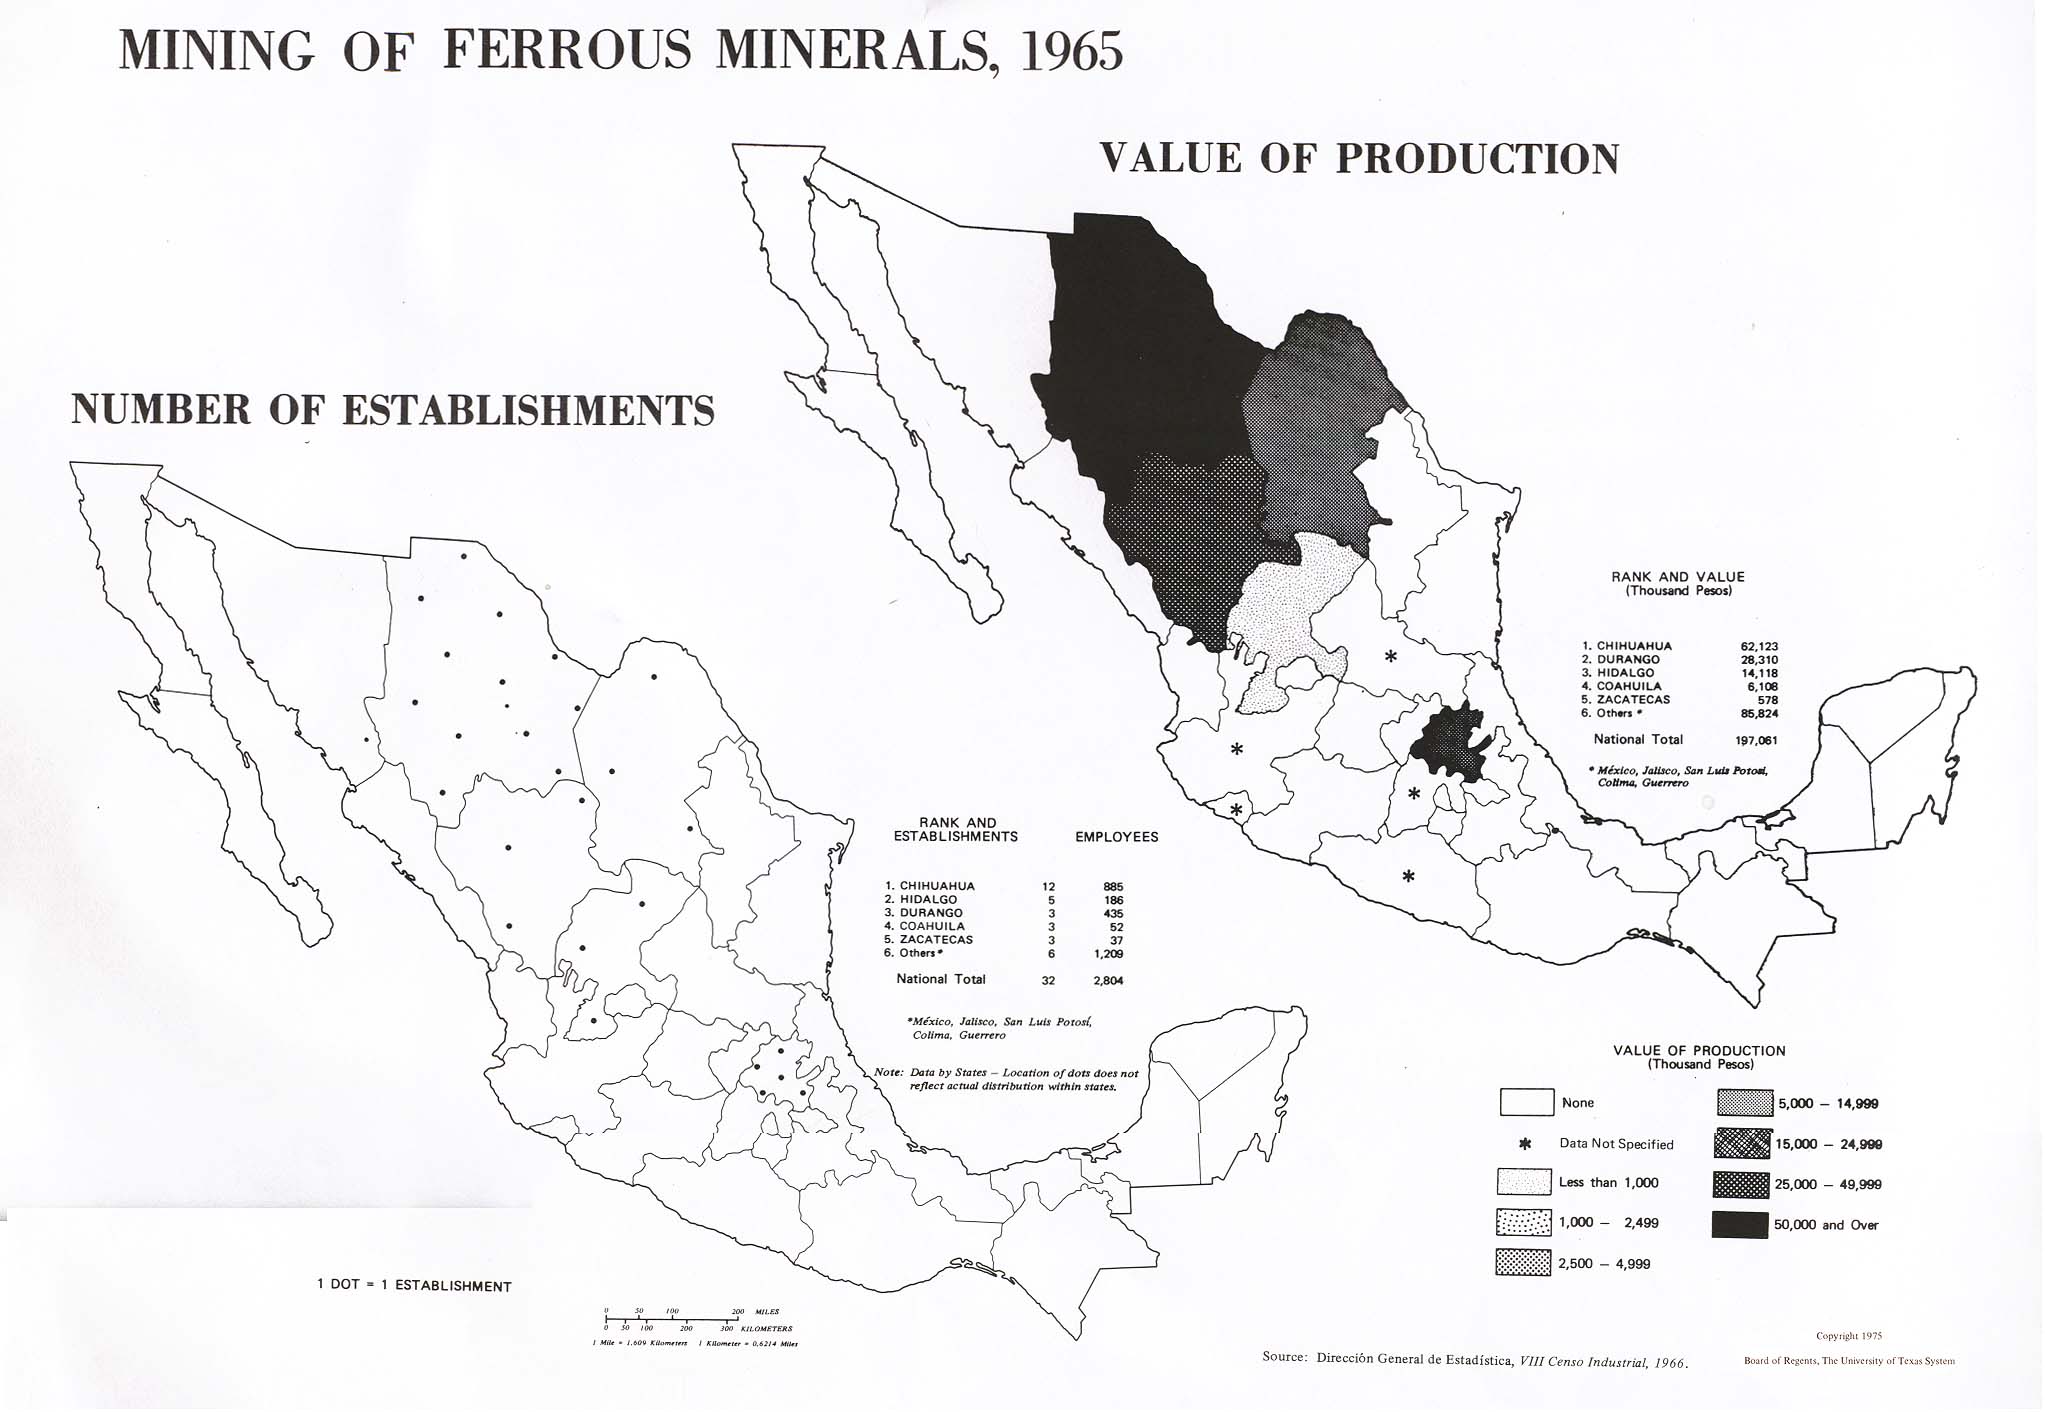
Mining of Ferrous Minerals, 1965 (186K)
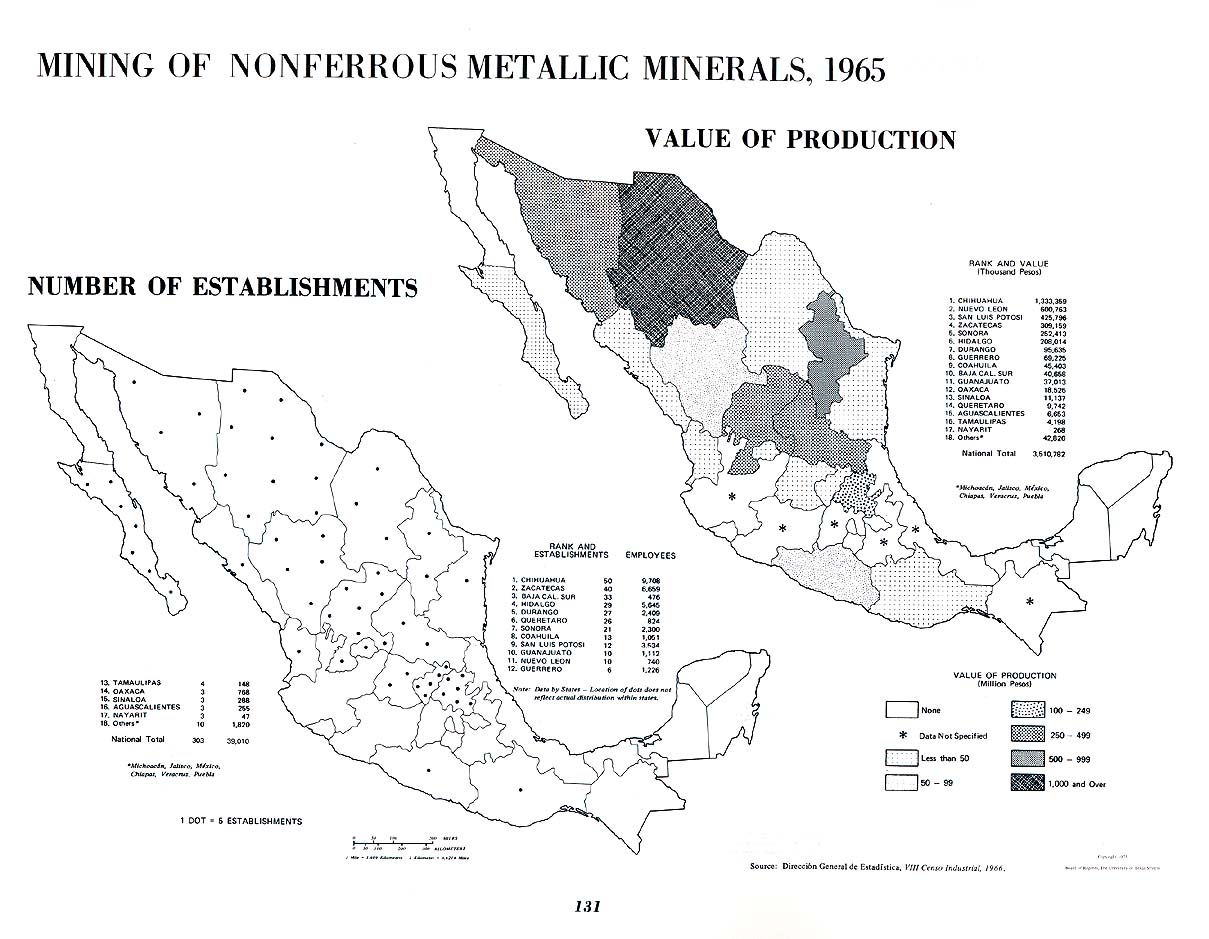
Mining of NonFerrous Metallic Minerals, 1965: Number of Establishments; Value of Production (186K)
Primary Iron and Steel Industries, 1965: Number of Establishments; Value of Production (175K)
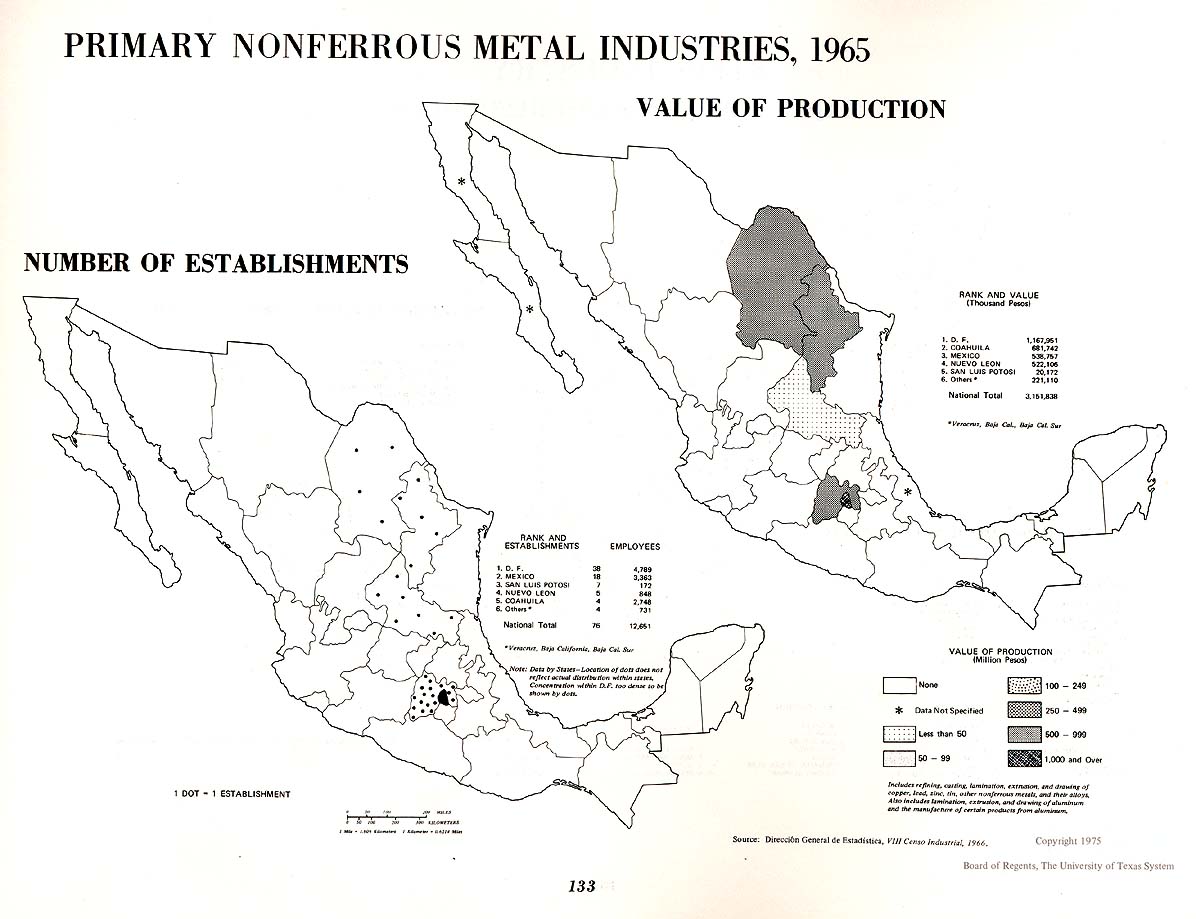
Primary Nonferrous Metal Industries, 1965: Number of Establishments; Value of Production (175K)
Steel Industry: Major Facilities and Resources (242K)
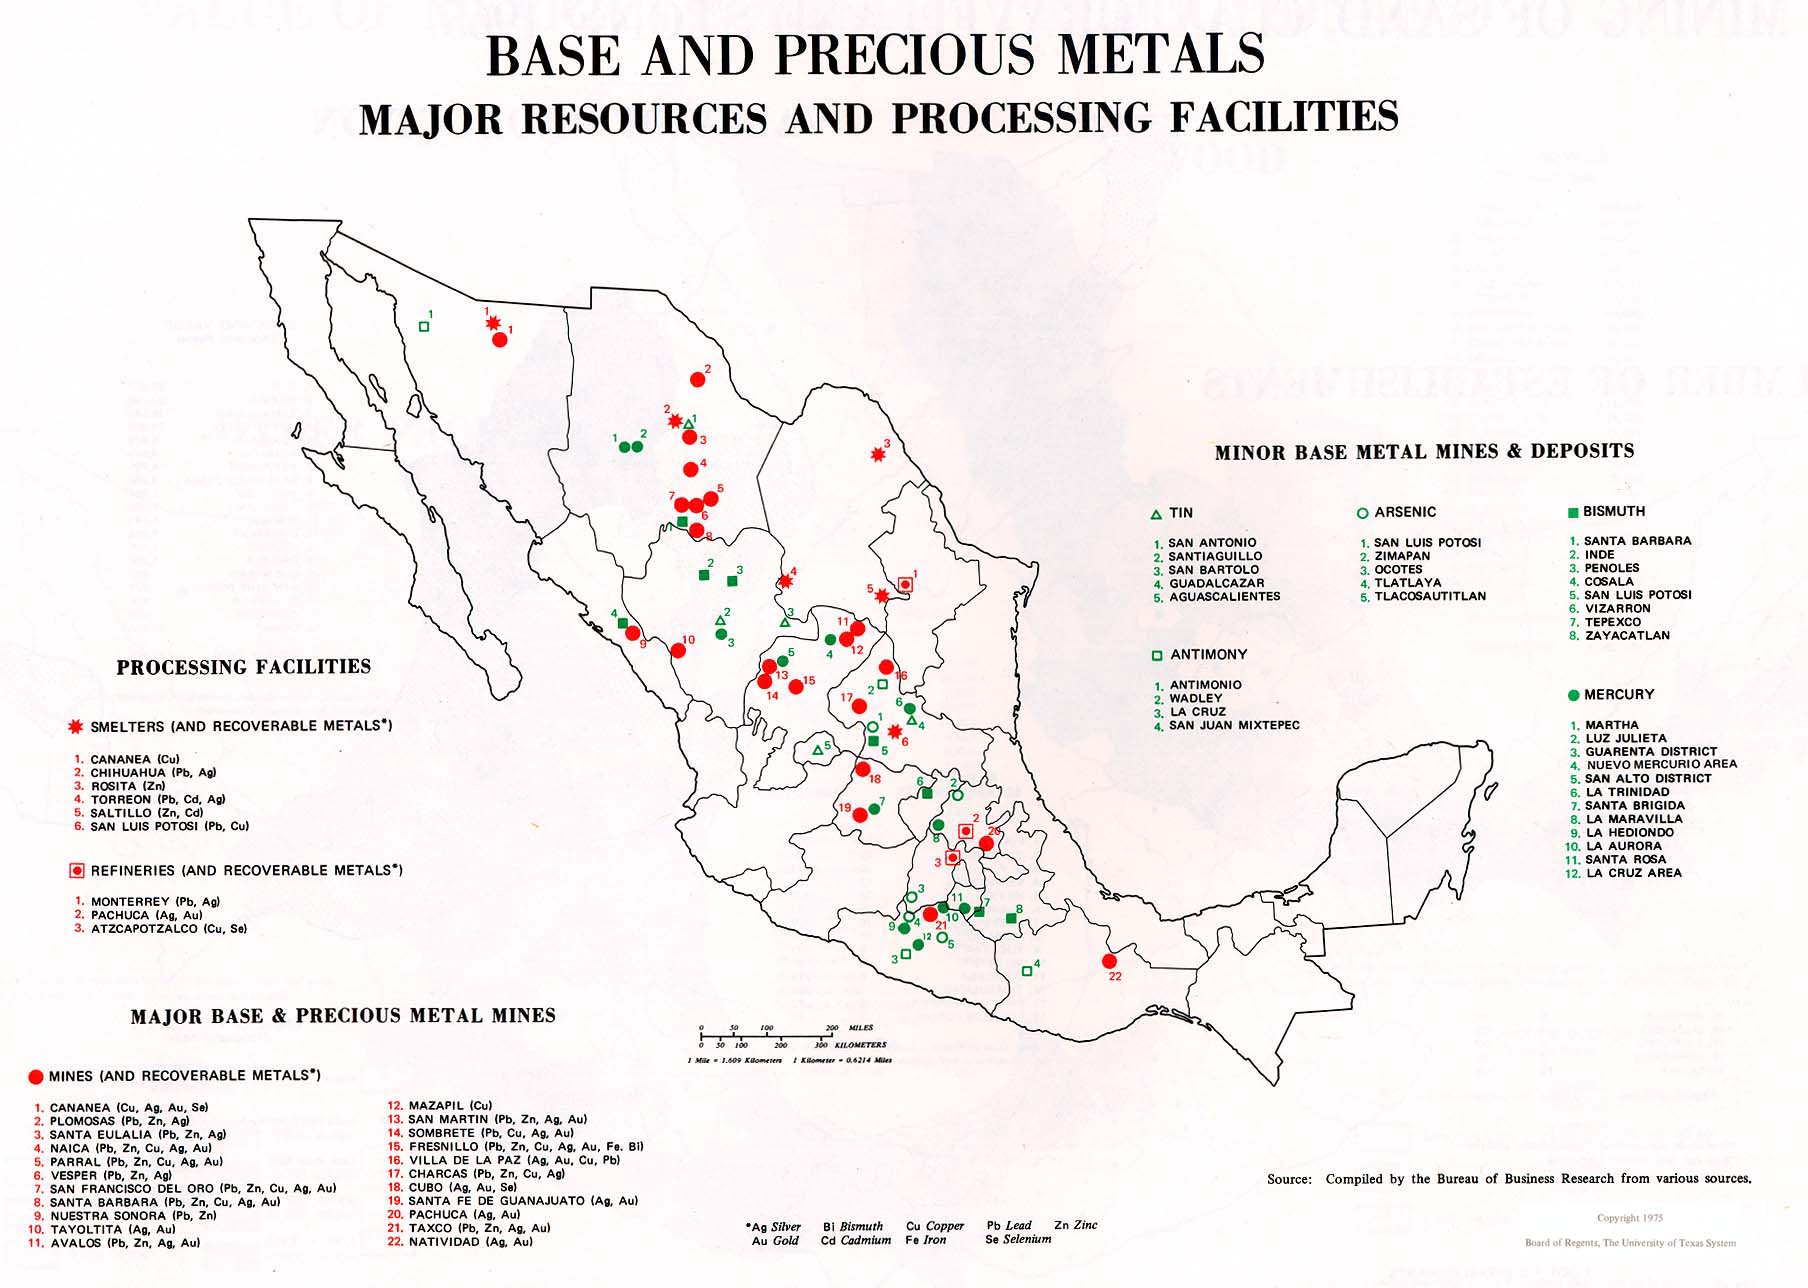
Base and Precious Metals: Major Resources and Processing Facilities (231K)
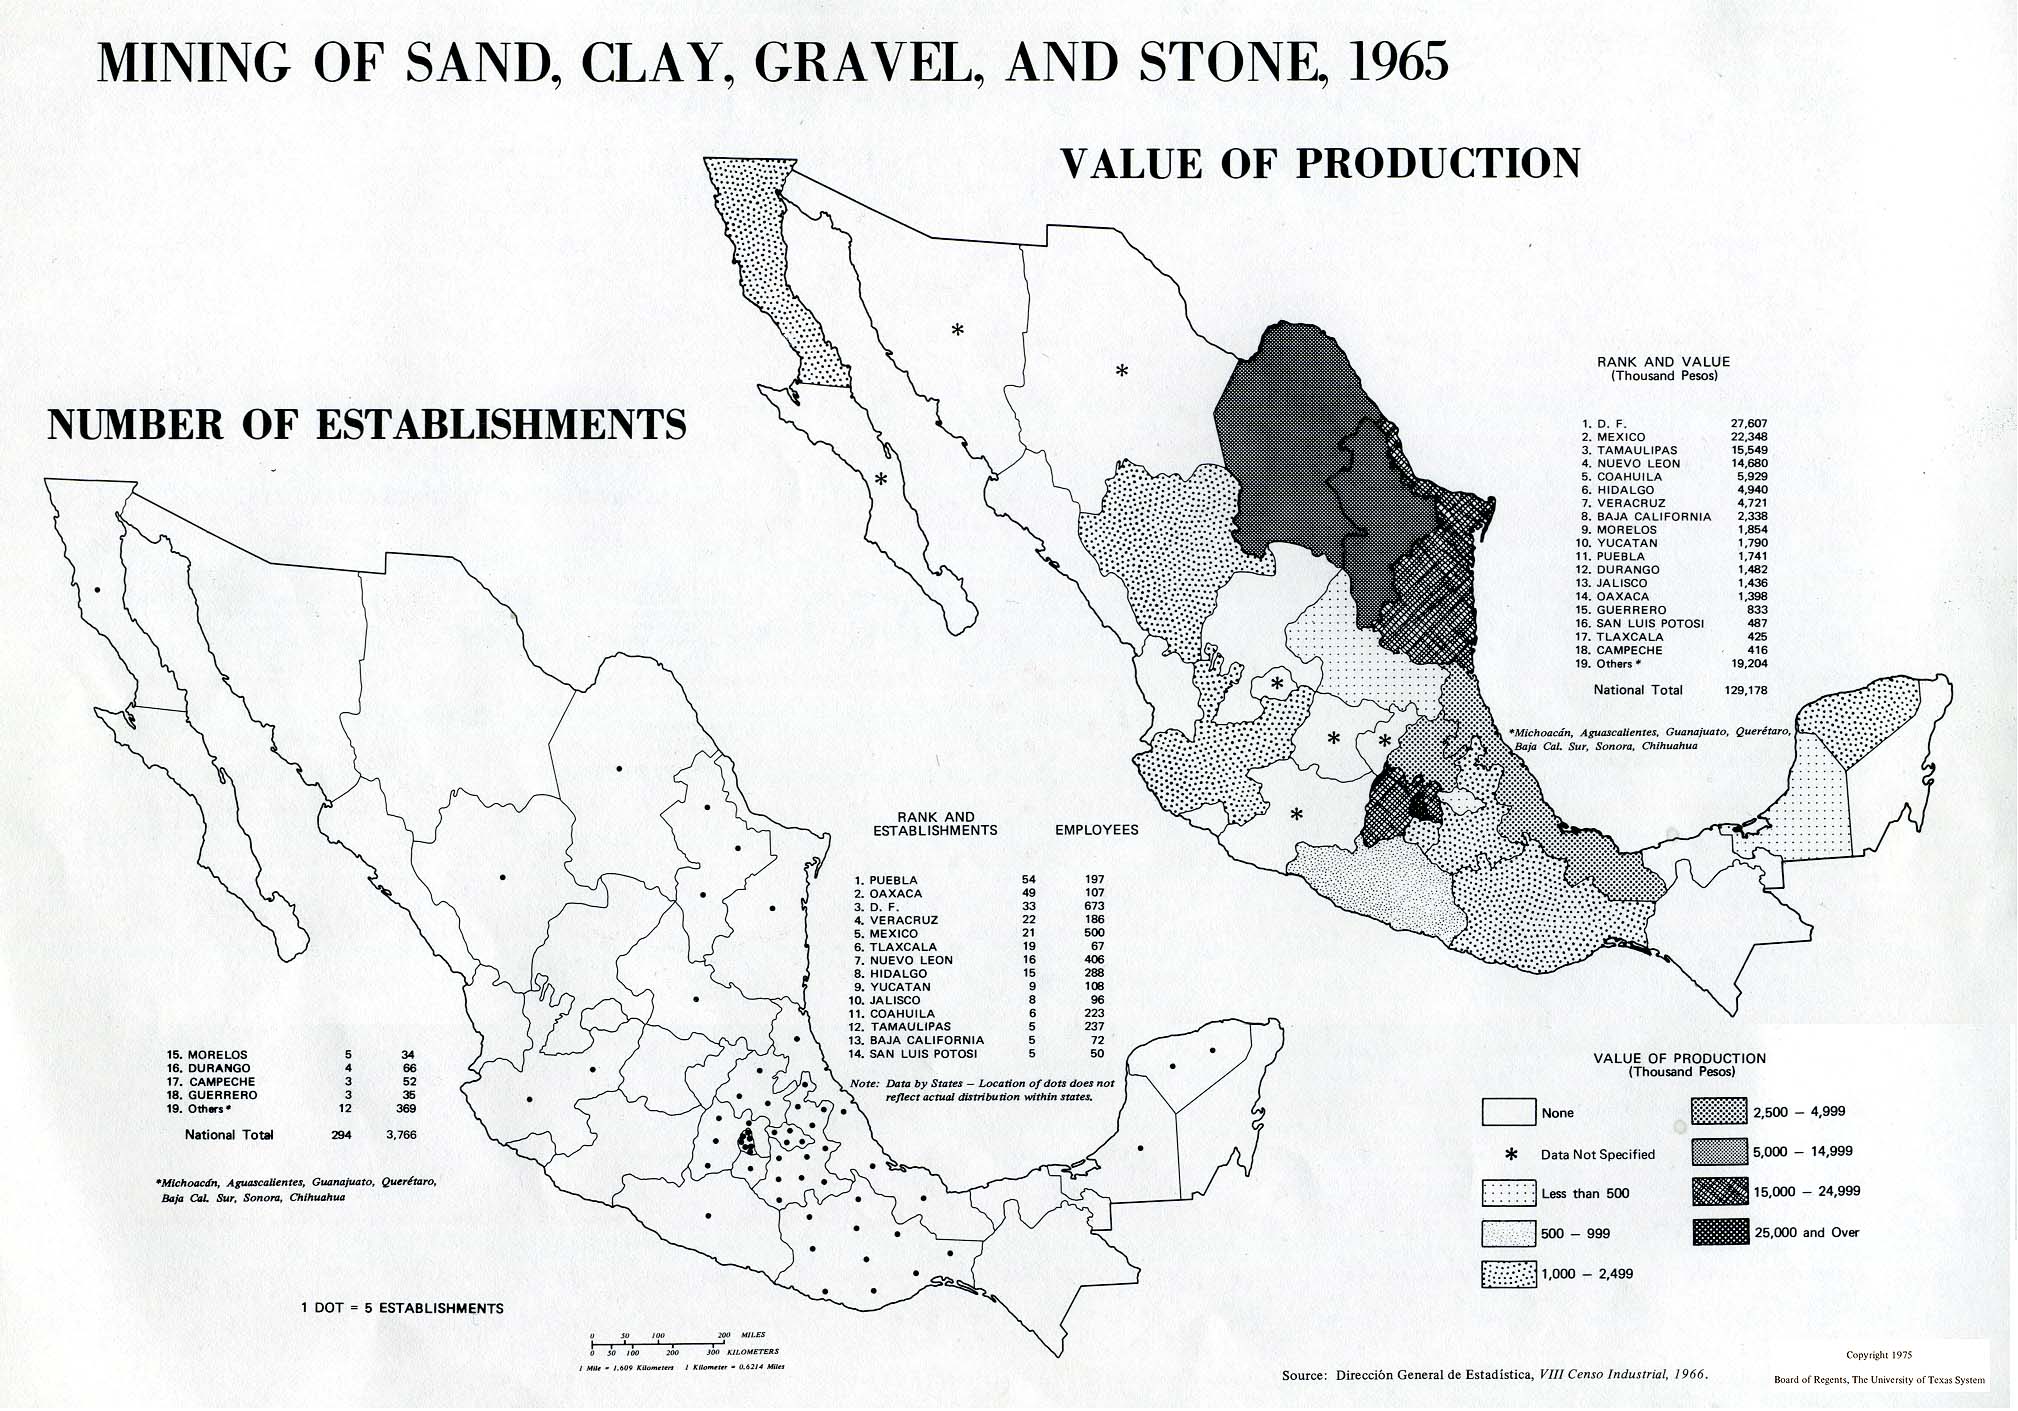
Mining of Sand, Clay, Gravel and Stone, 1965: Number of Establishments; Value of Production (377K)
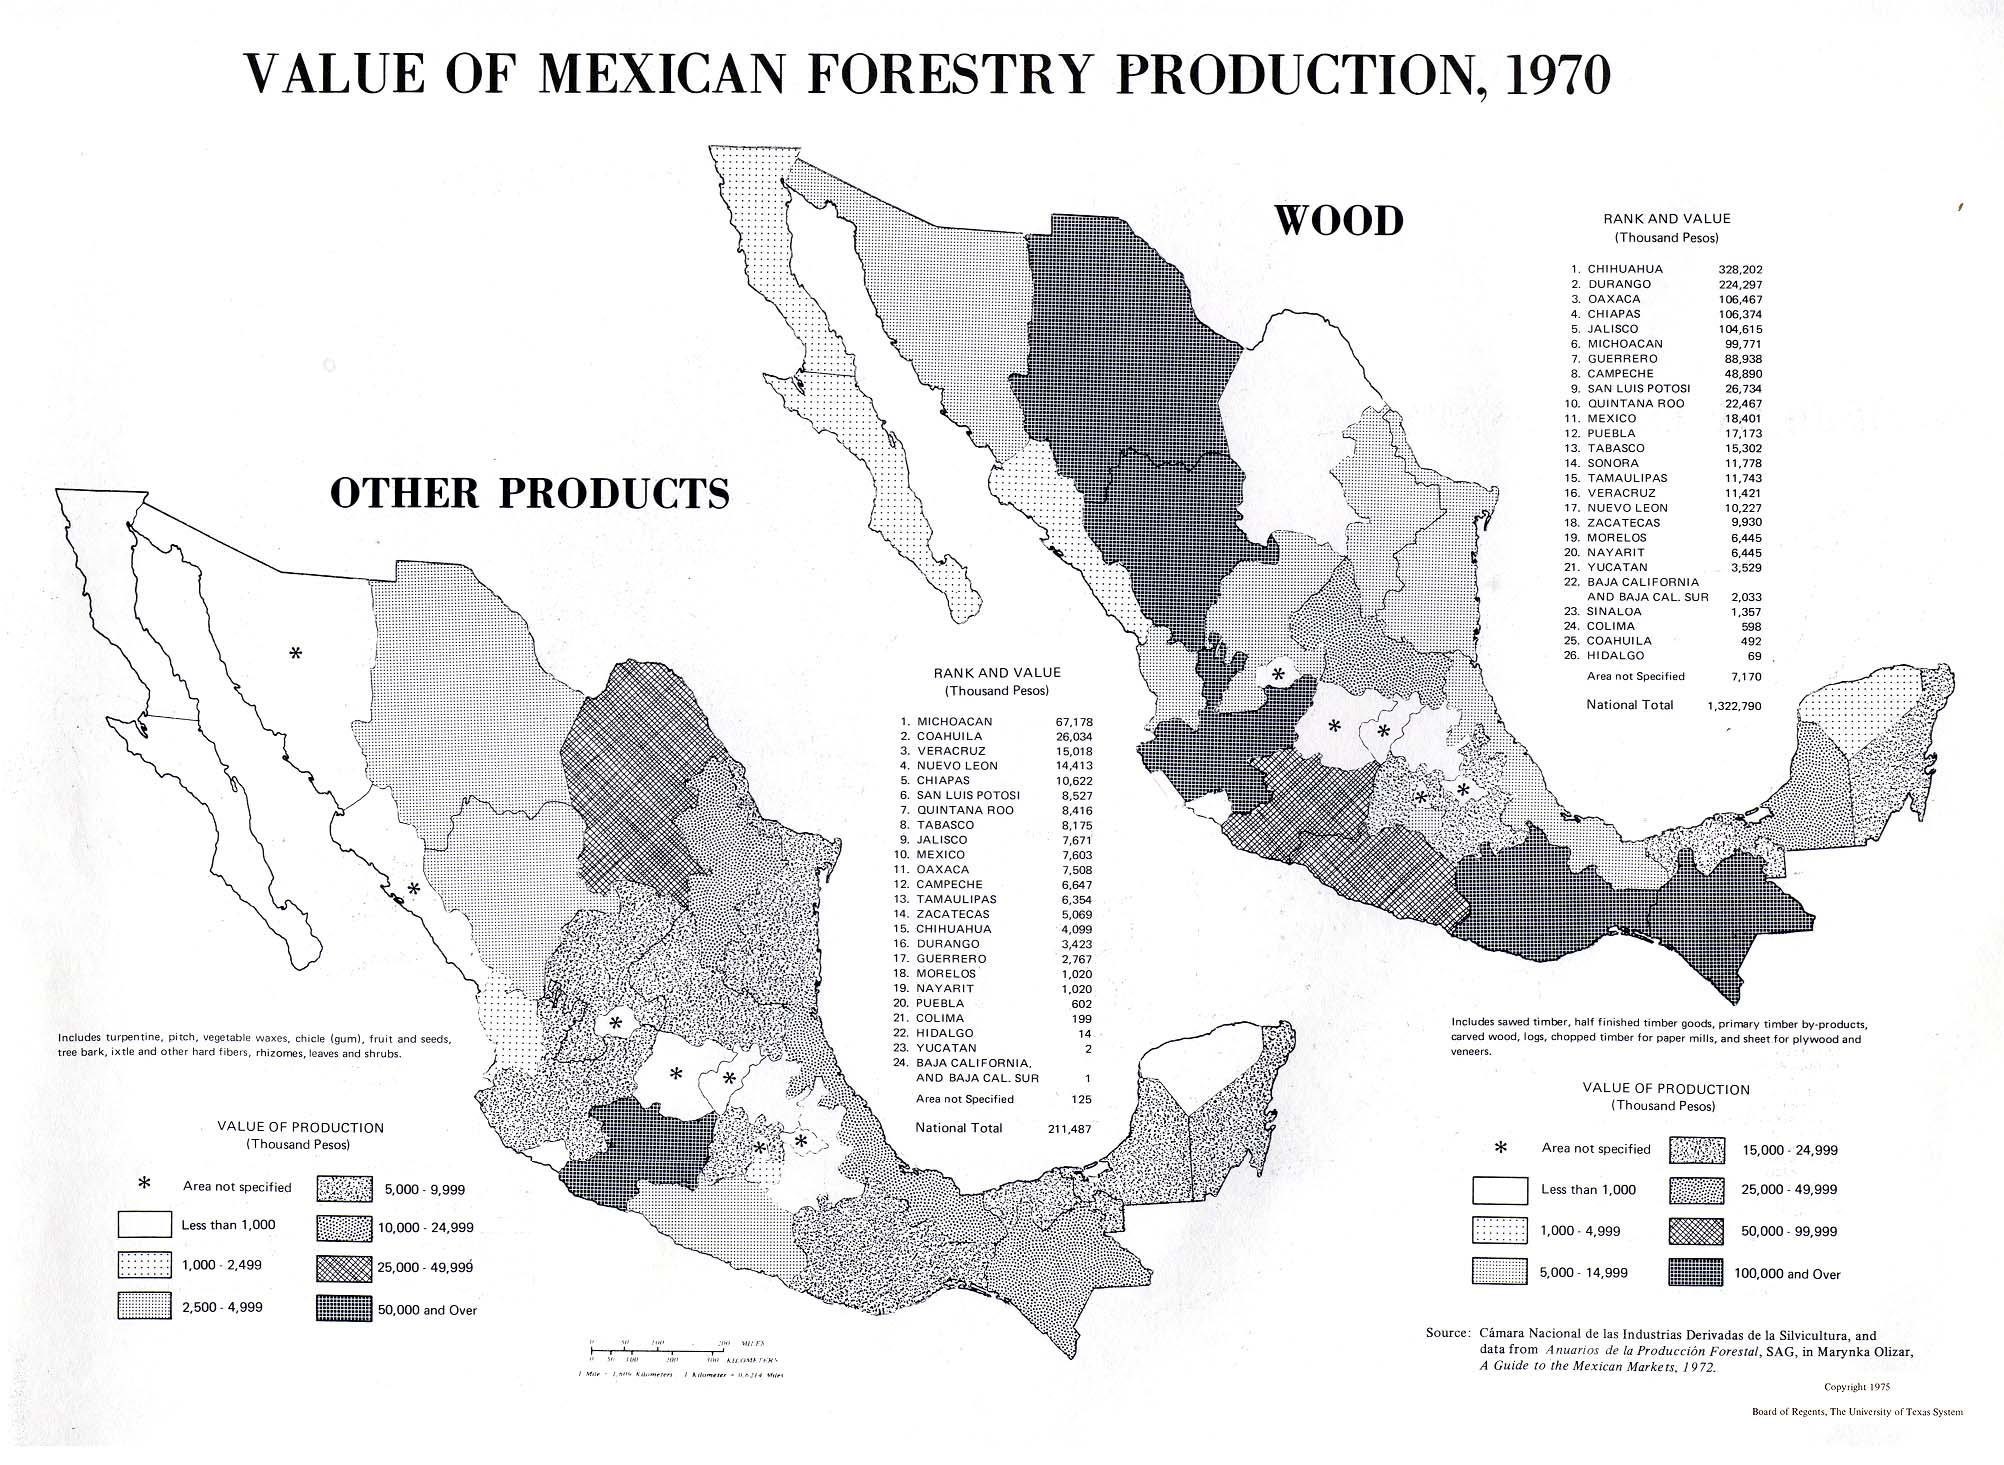
Value of Mexican Forestry Production, 1970: Wood; Other Products (516K)
Manufacture of Chemical Products, 1965: Number of Establishments; Value of Production (414K)
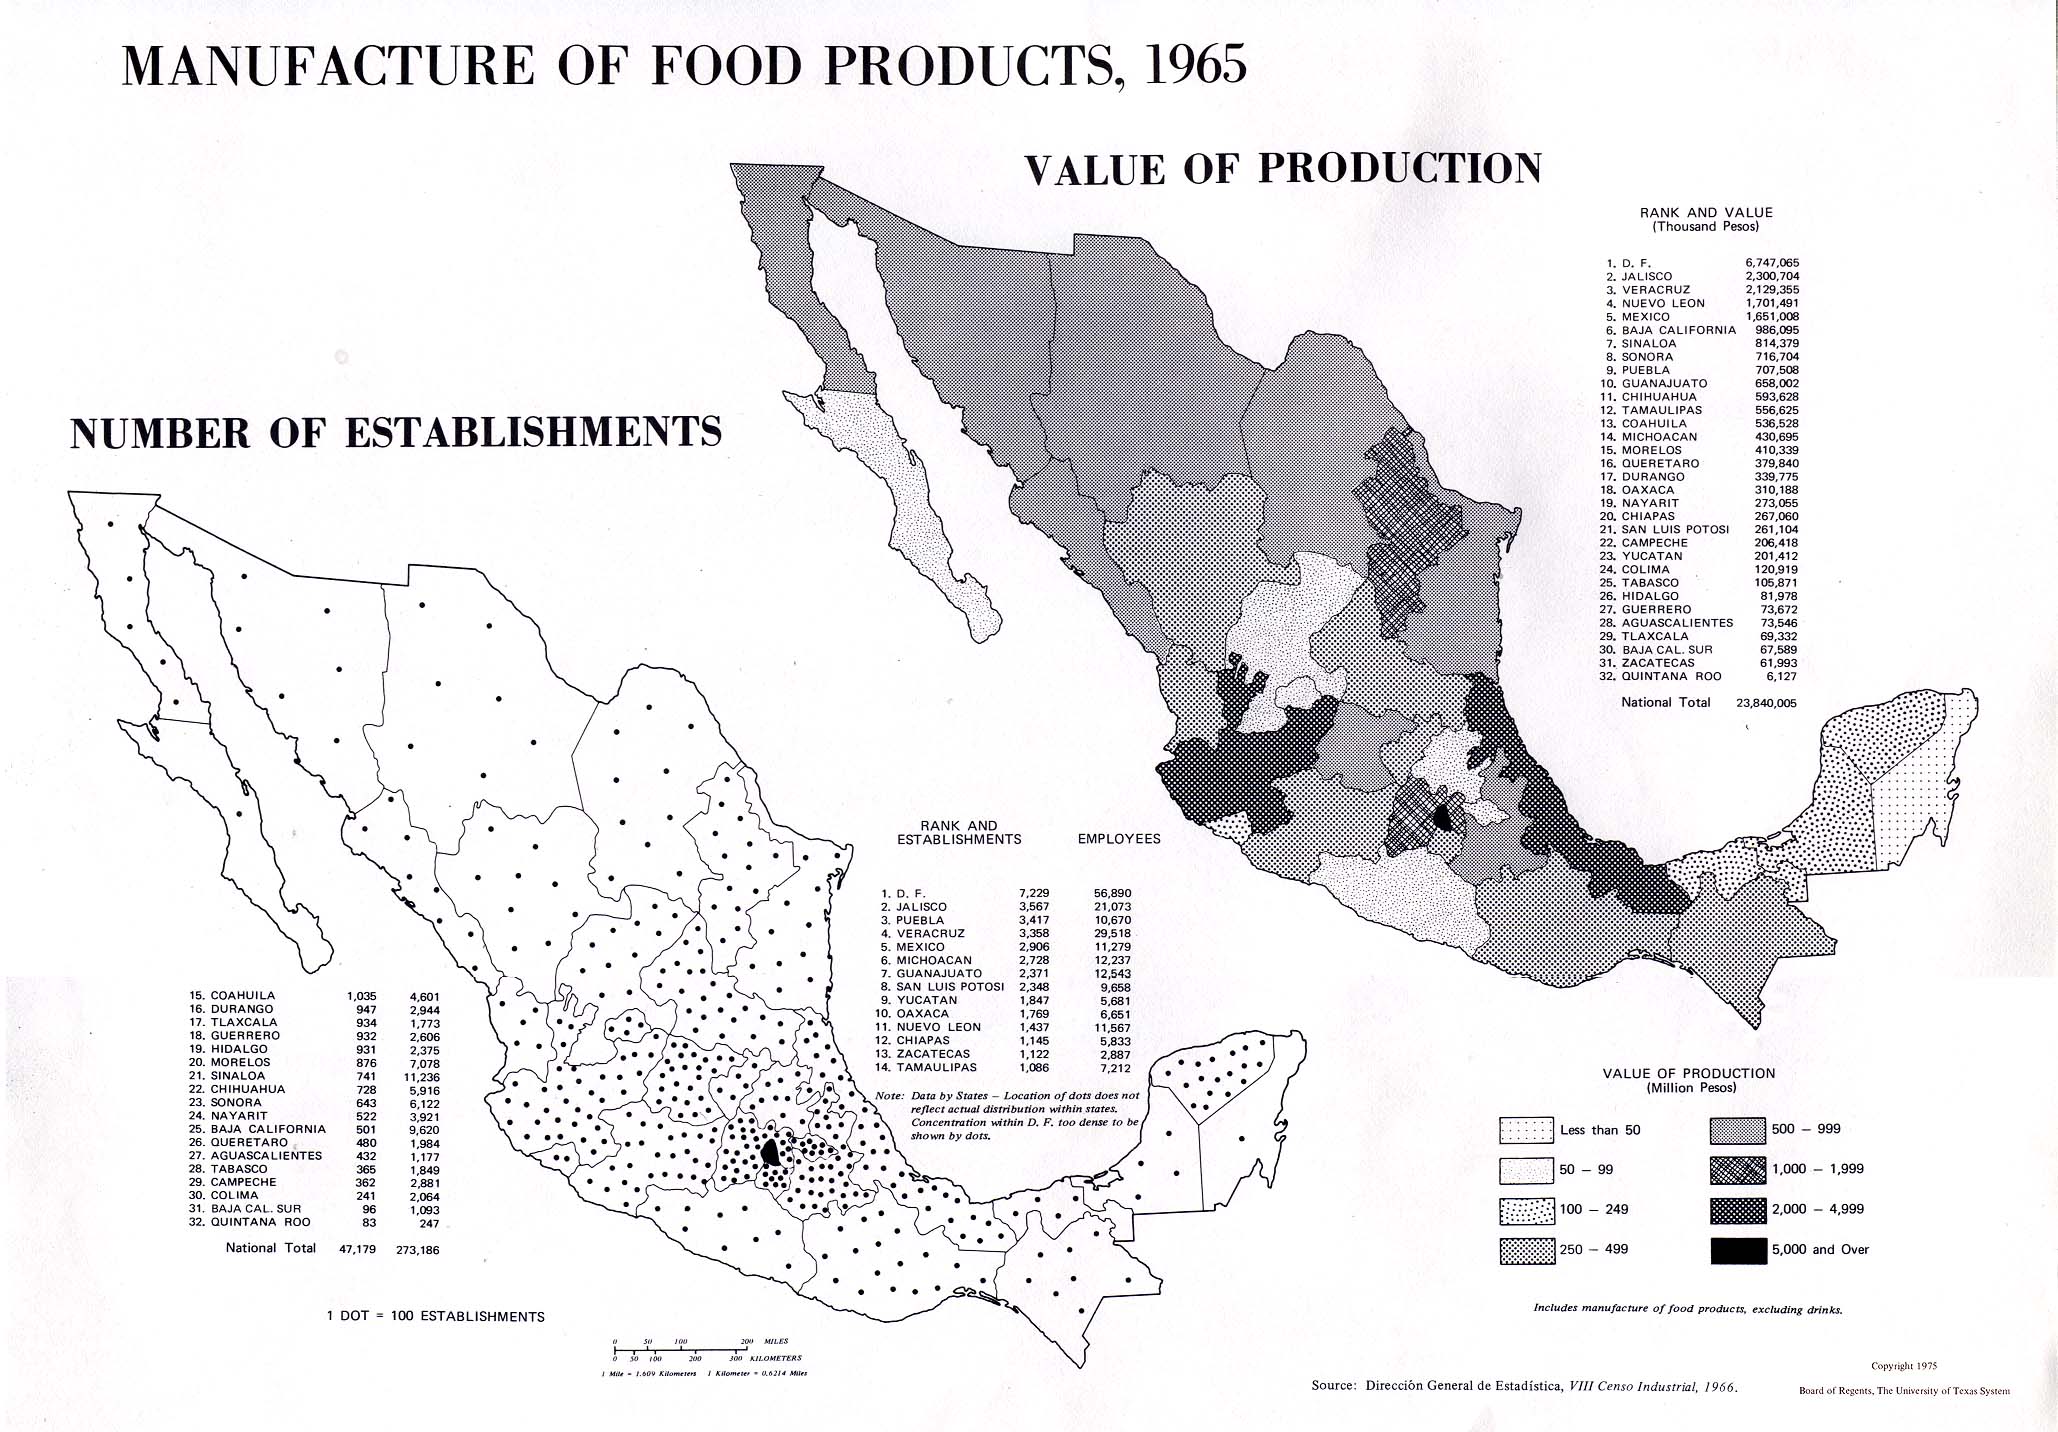
Manufacture of Food Products, 1965: Number of Establishments; Value of Production (448K)
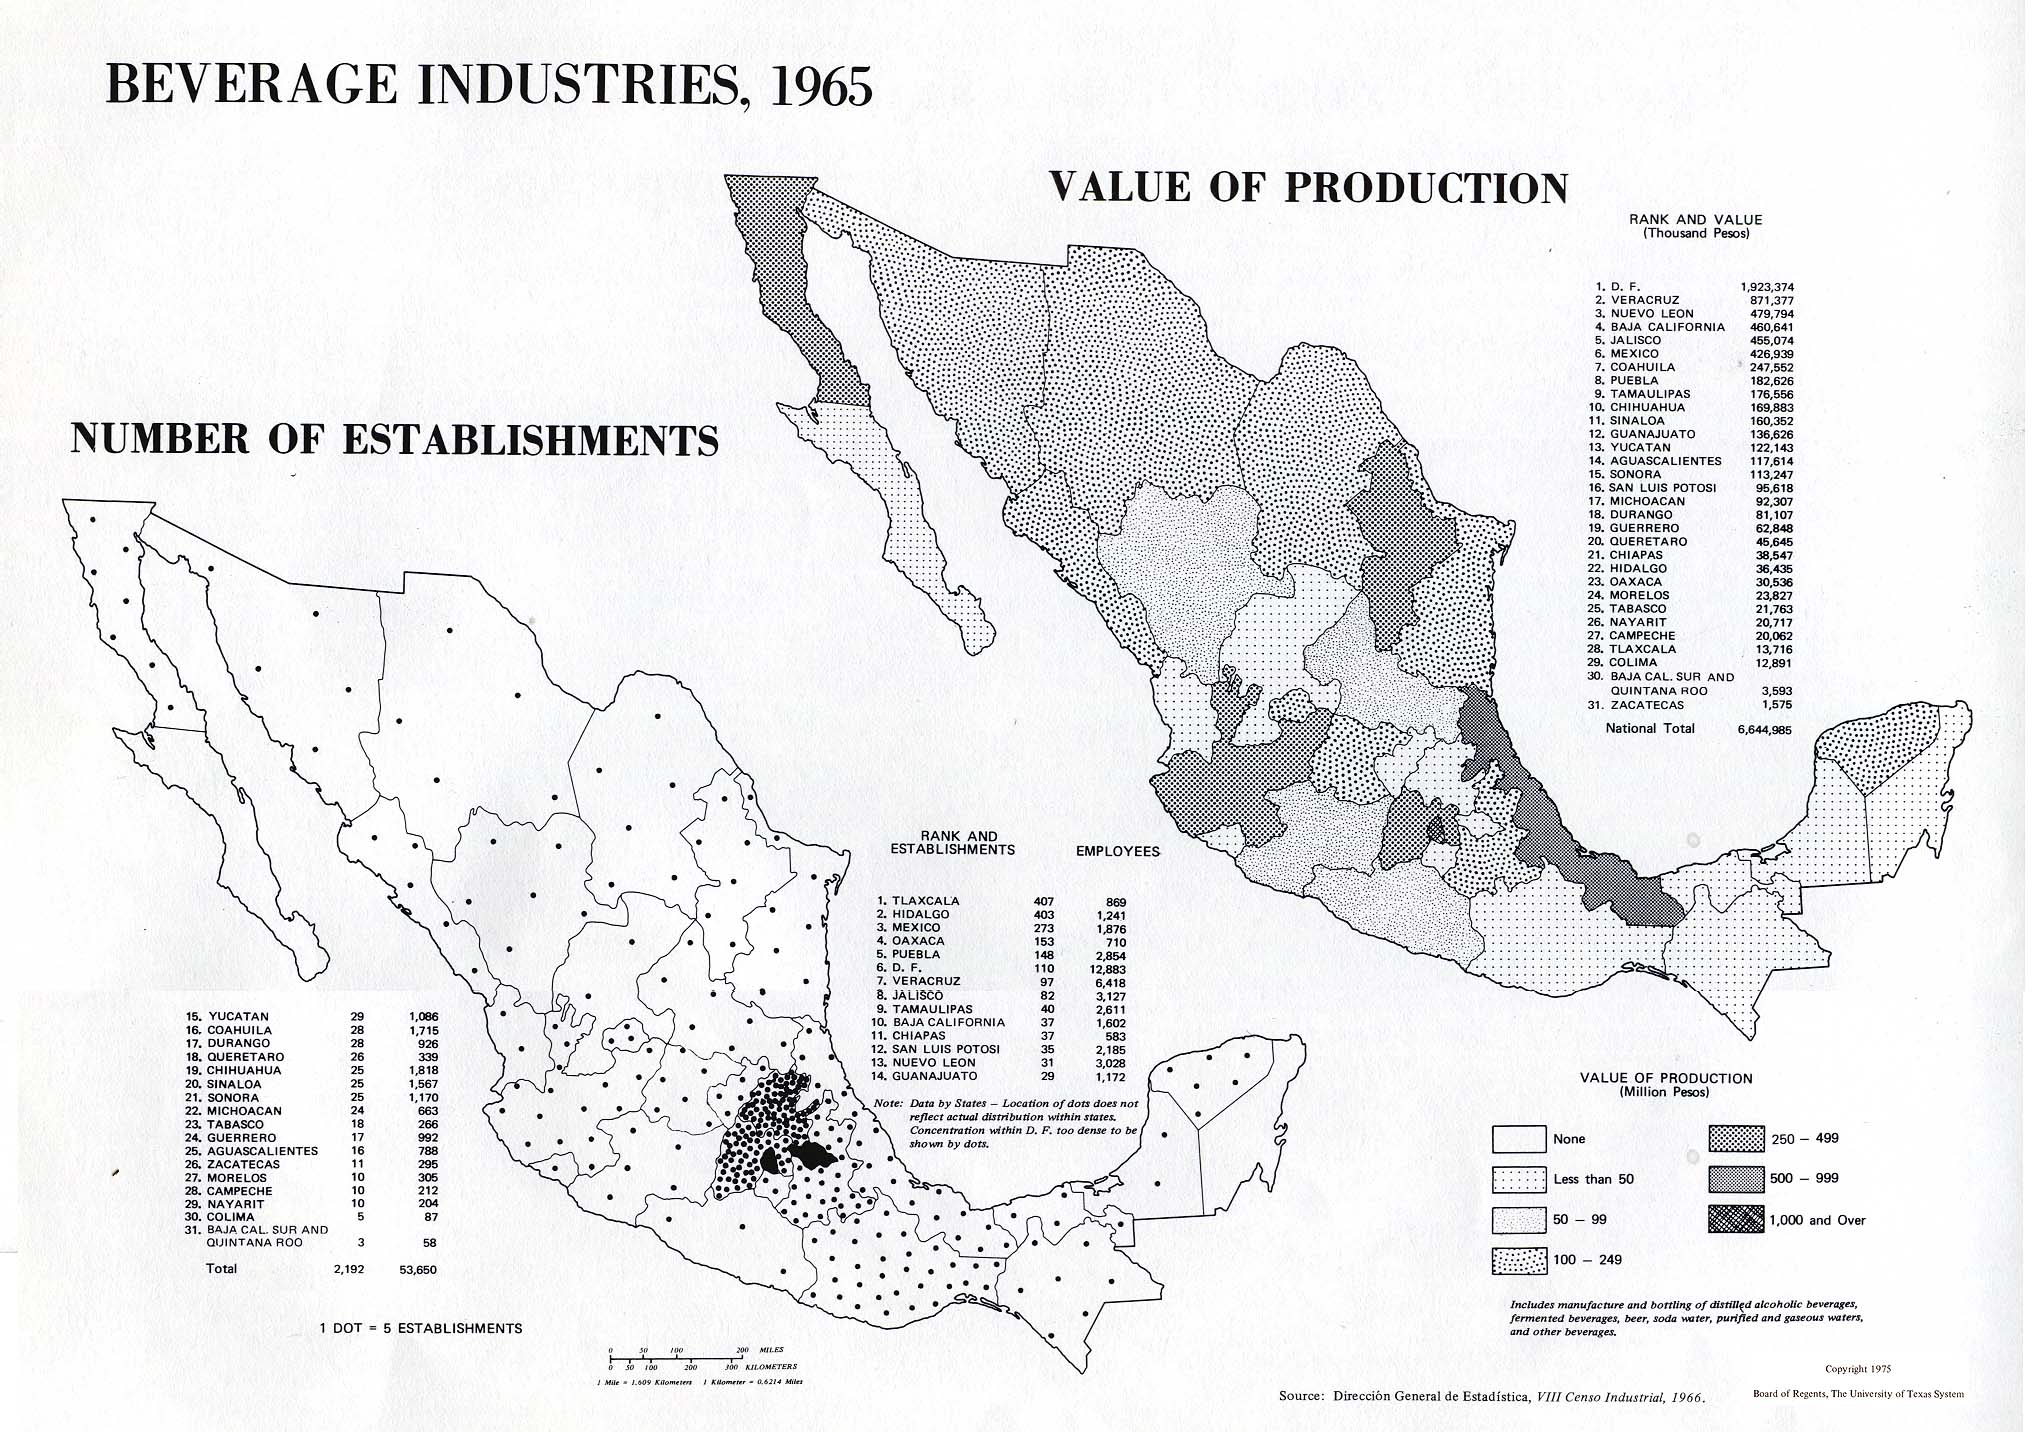
Beverage Industries, 1965: Number of Establishments; Value of Production (466K)
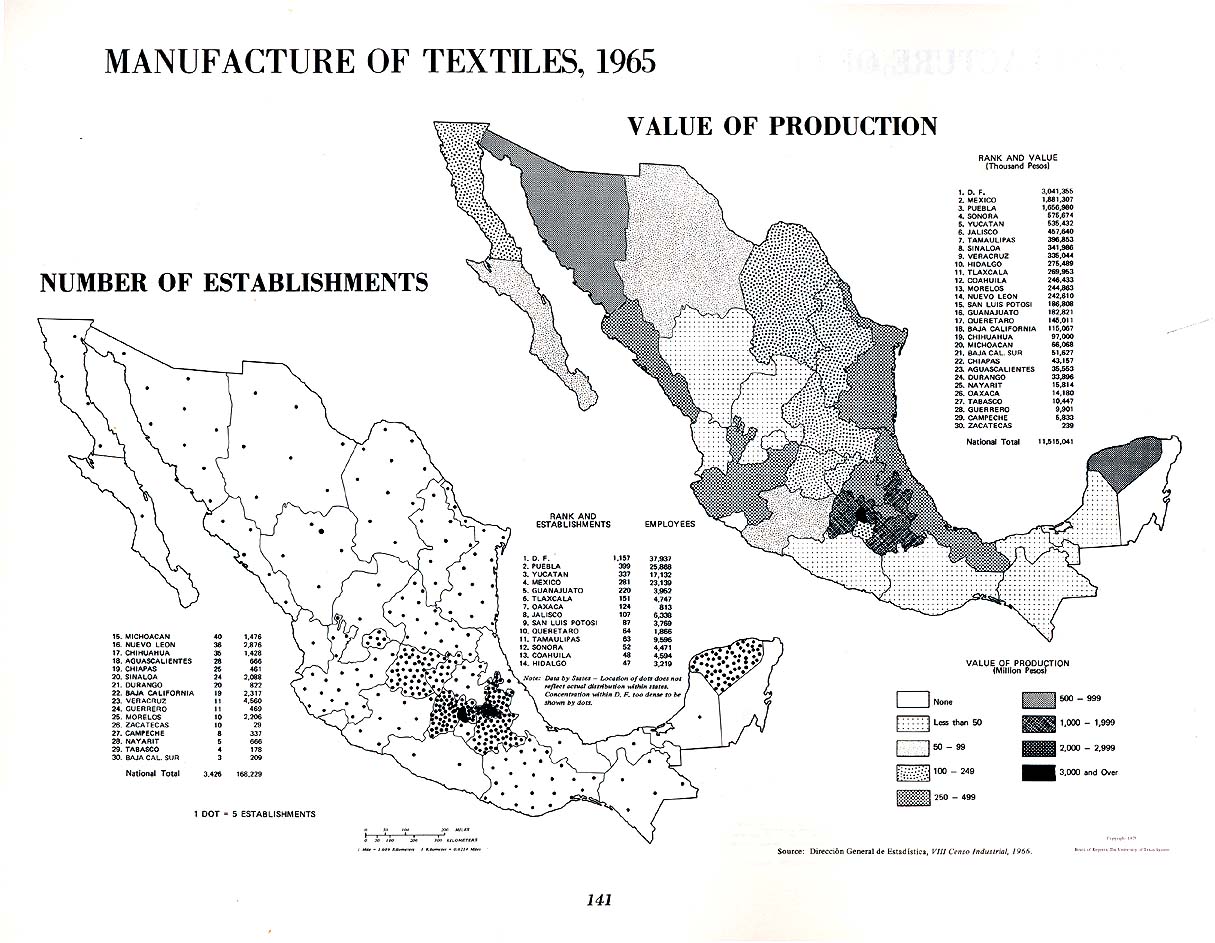
Manufacture of Textiles, 1965: Number of Establishments; Value of Production (232K)
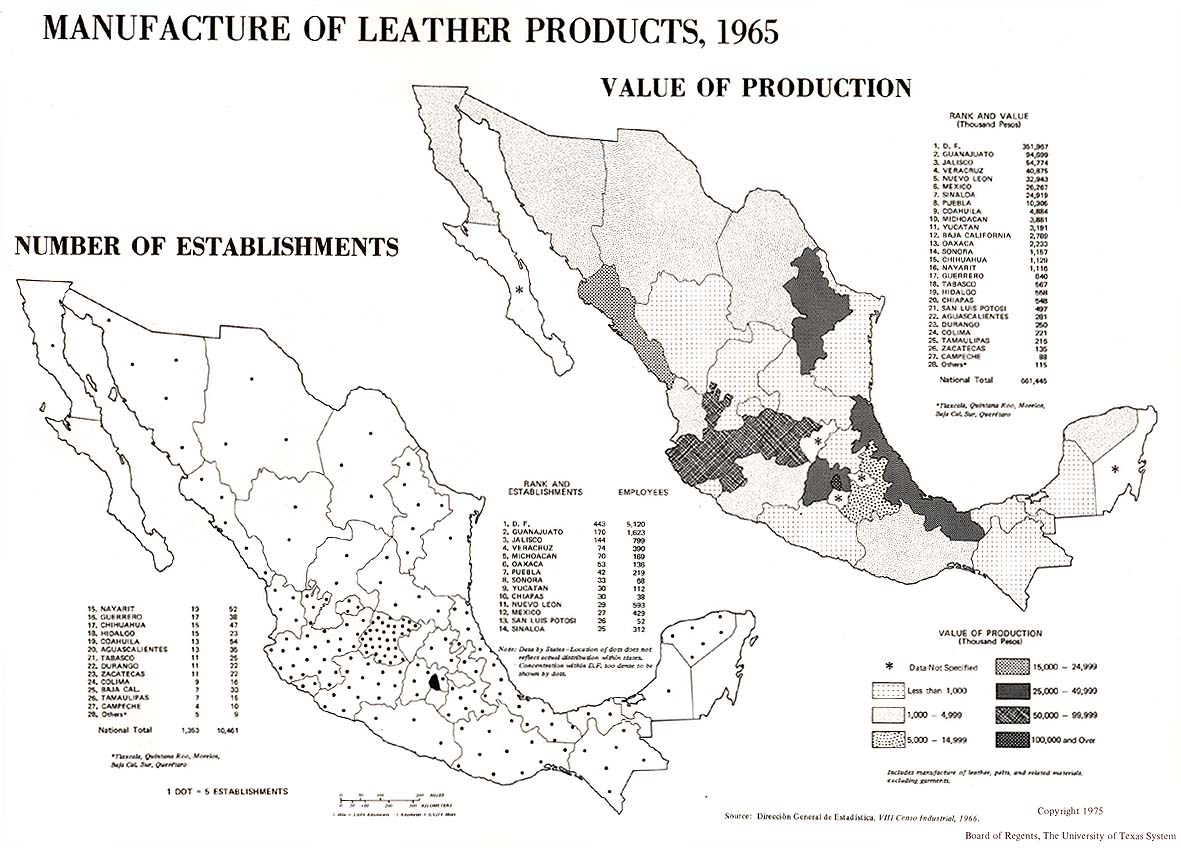
Manufacture of Leather Products, 1965: Number of Establishments; Value of Production (181K)
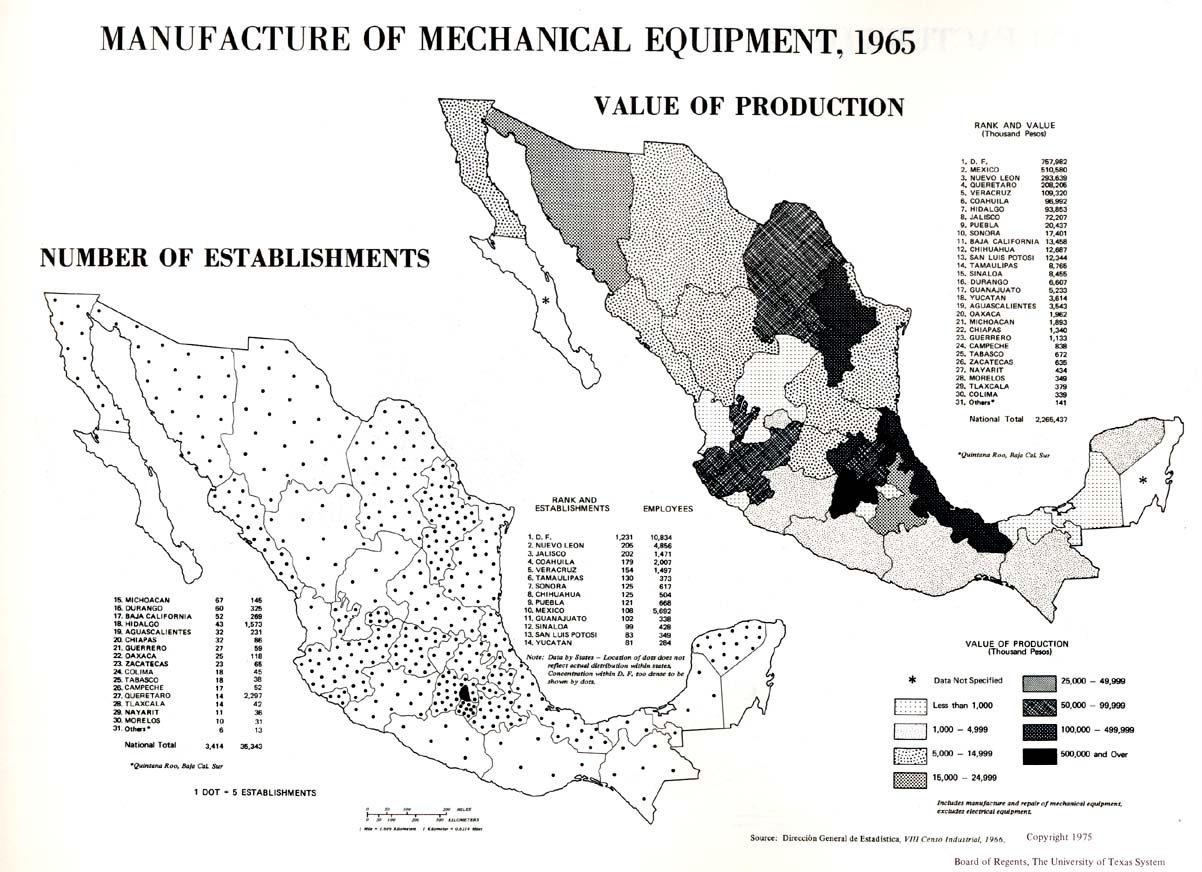
Manufacture of Mechanical Equipment, 1965: Number of Establishments; Value of Production (207K)
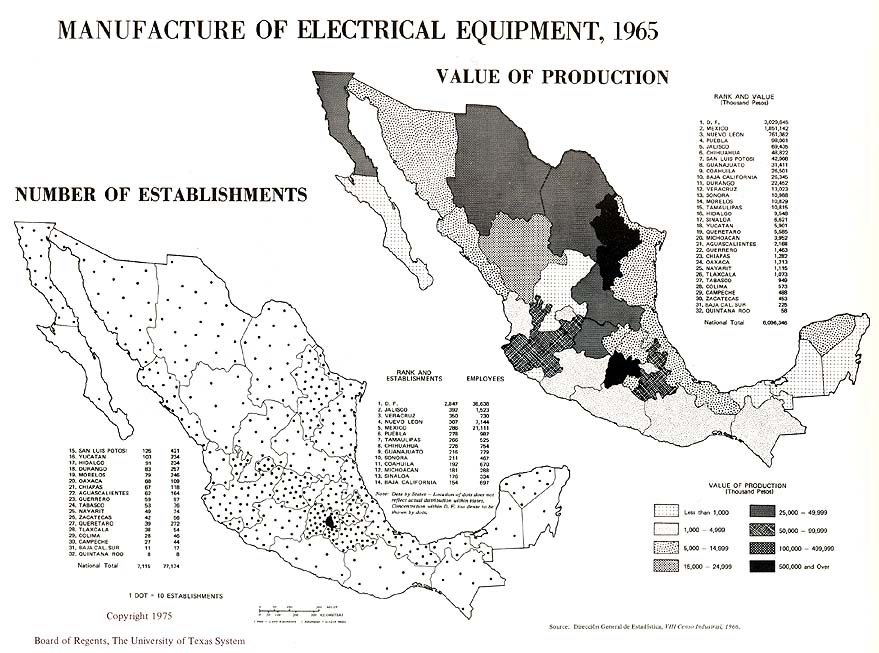
Manufacture of Electrical Equipment, 1965: Number of Establishments; Value of Production (143K)
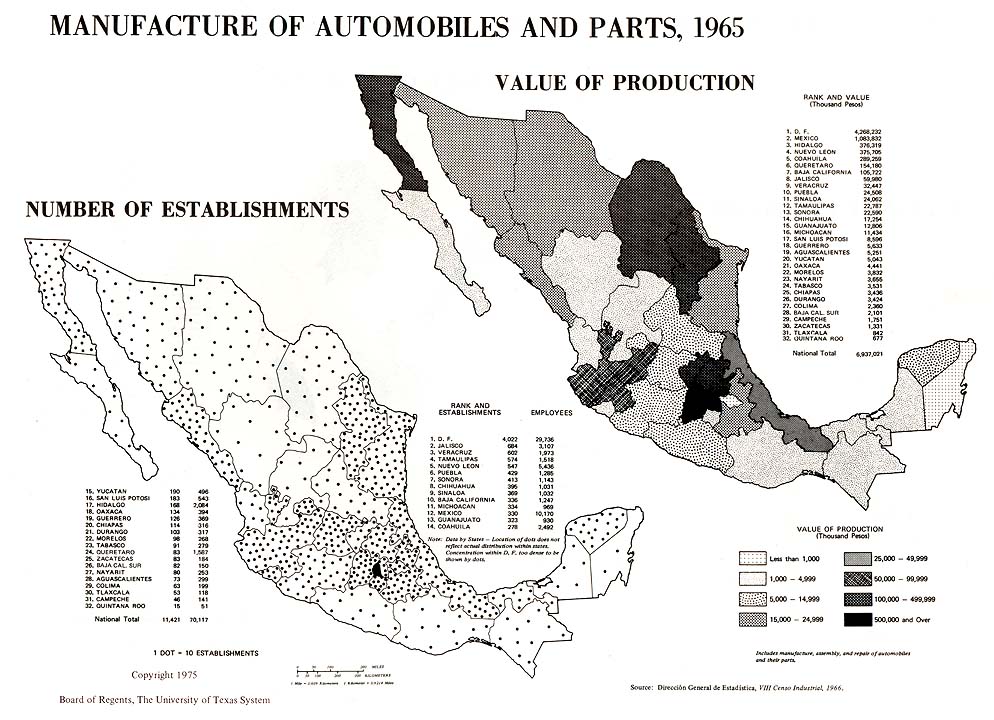
Manufacture of Automobiles and Parts, 1965: Number of Establishments; Value of Production (186K)
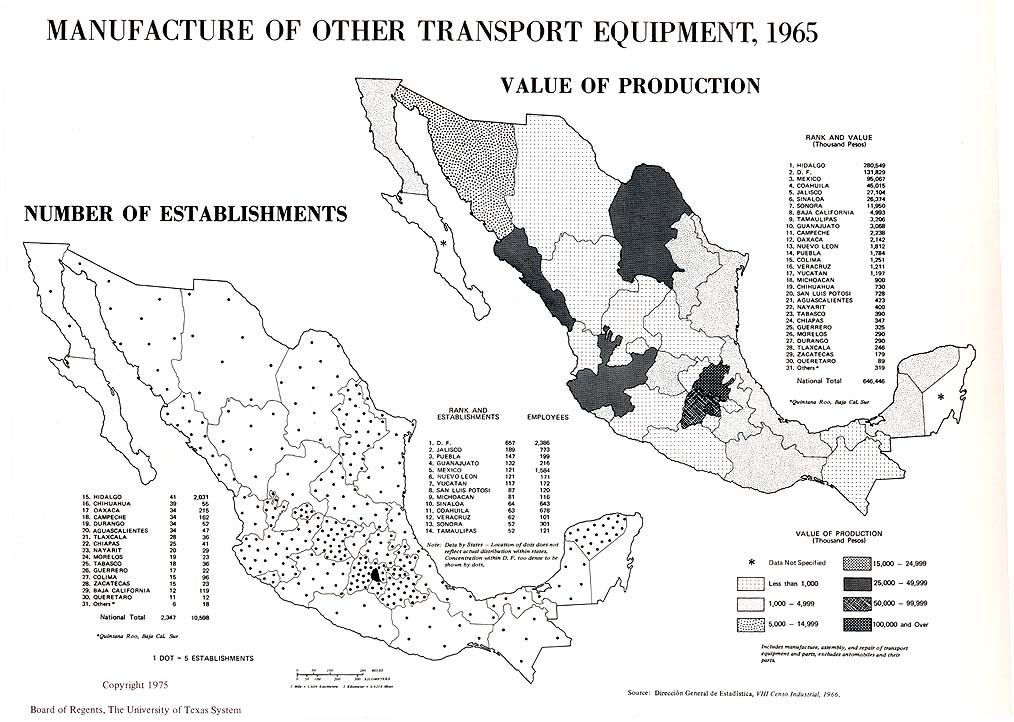
Manufacture of Other Transport Equipment, 1965: Number of Establishments; Value of Production (168K)
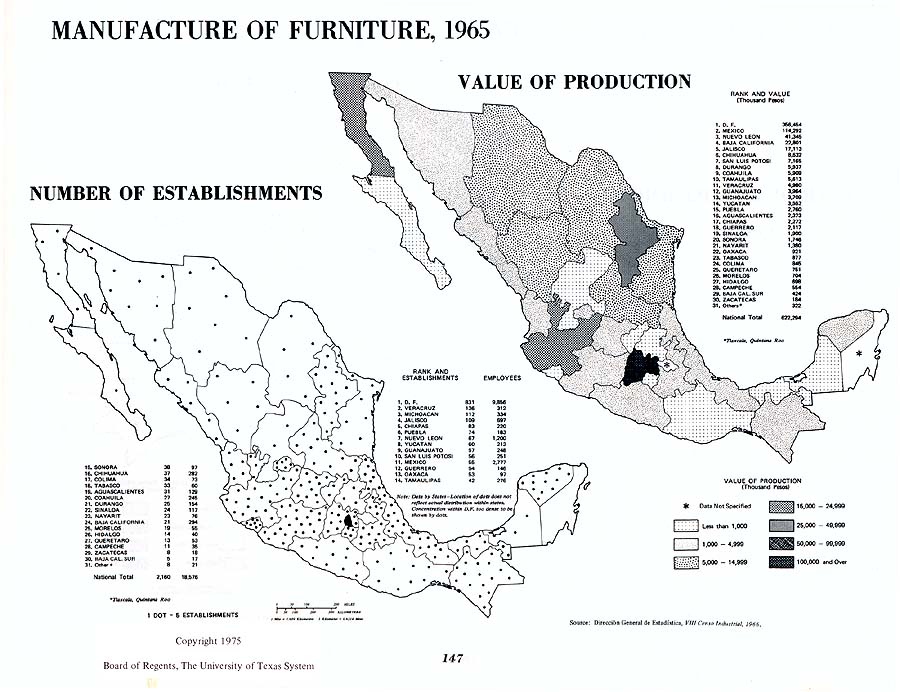
Manufacture of Furniture, 1965: Number of Establishments; Value of Production (153K)
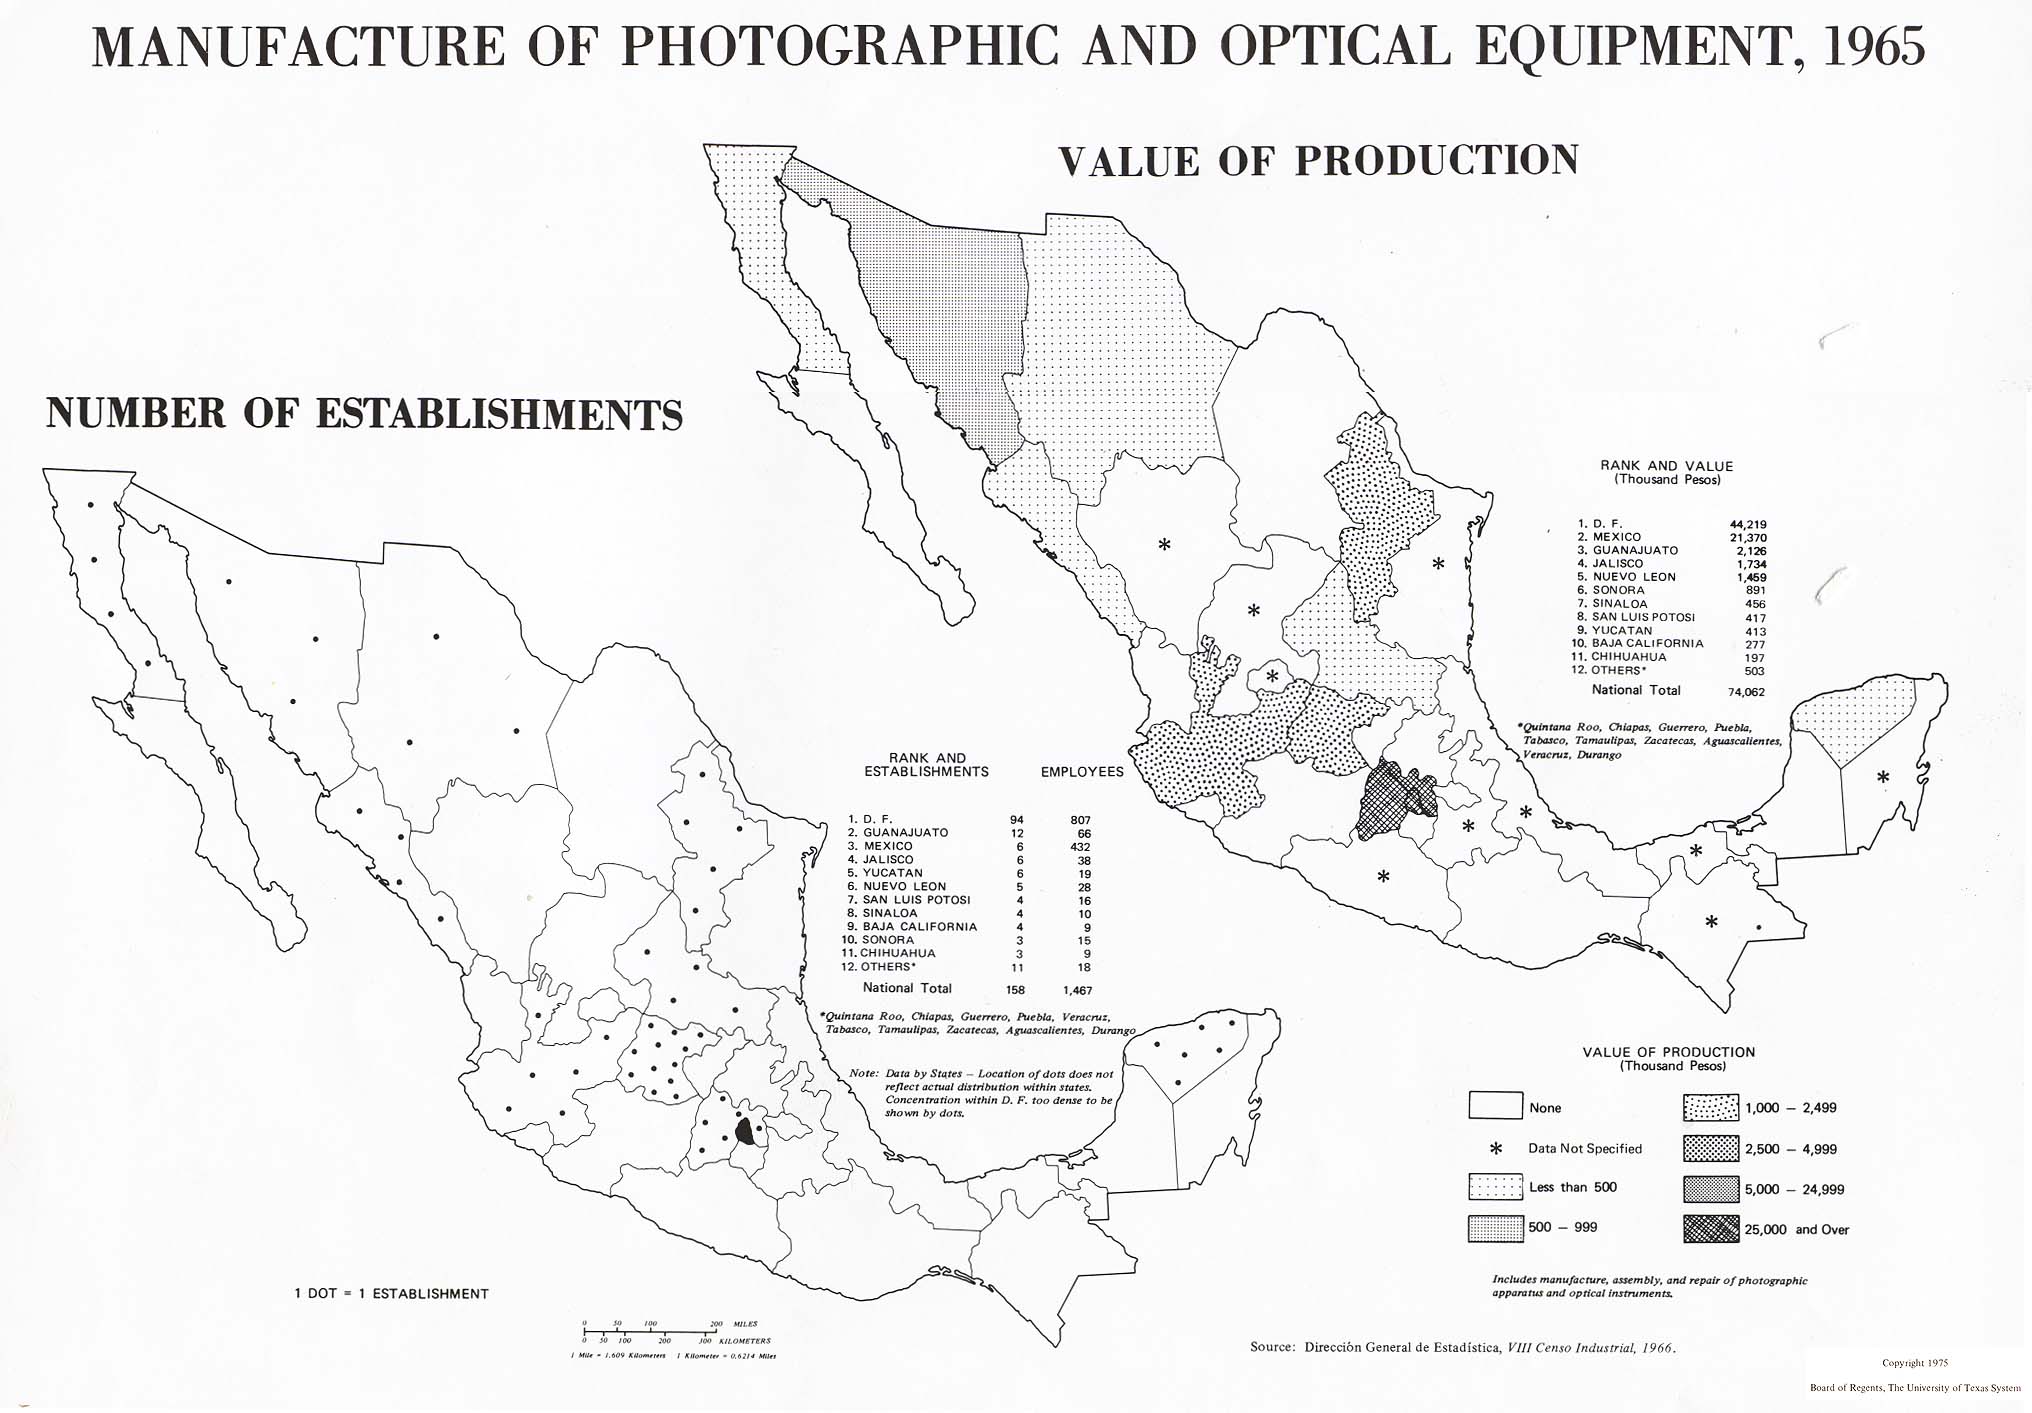
Manufacture of Photographic and Optical Equipment, 1965: Number of Establishments; Value of Production (280K)
Manufacture of Scientific Instruments, 1965: Number of Establishments; Value of Production (243K)
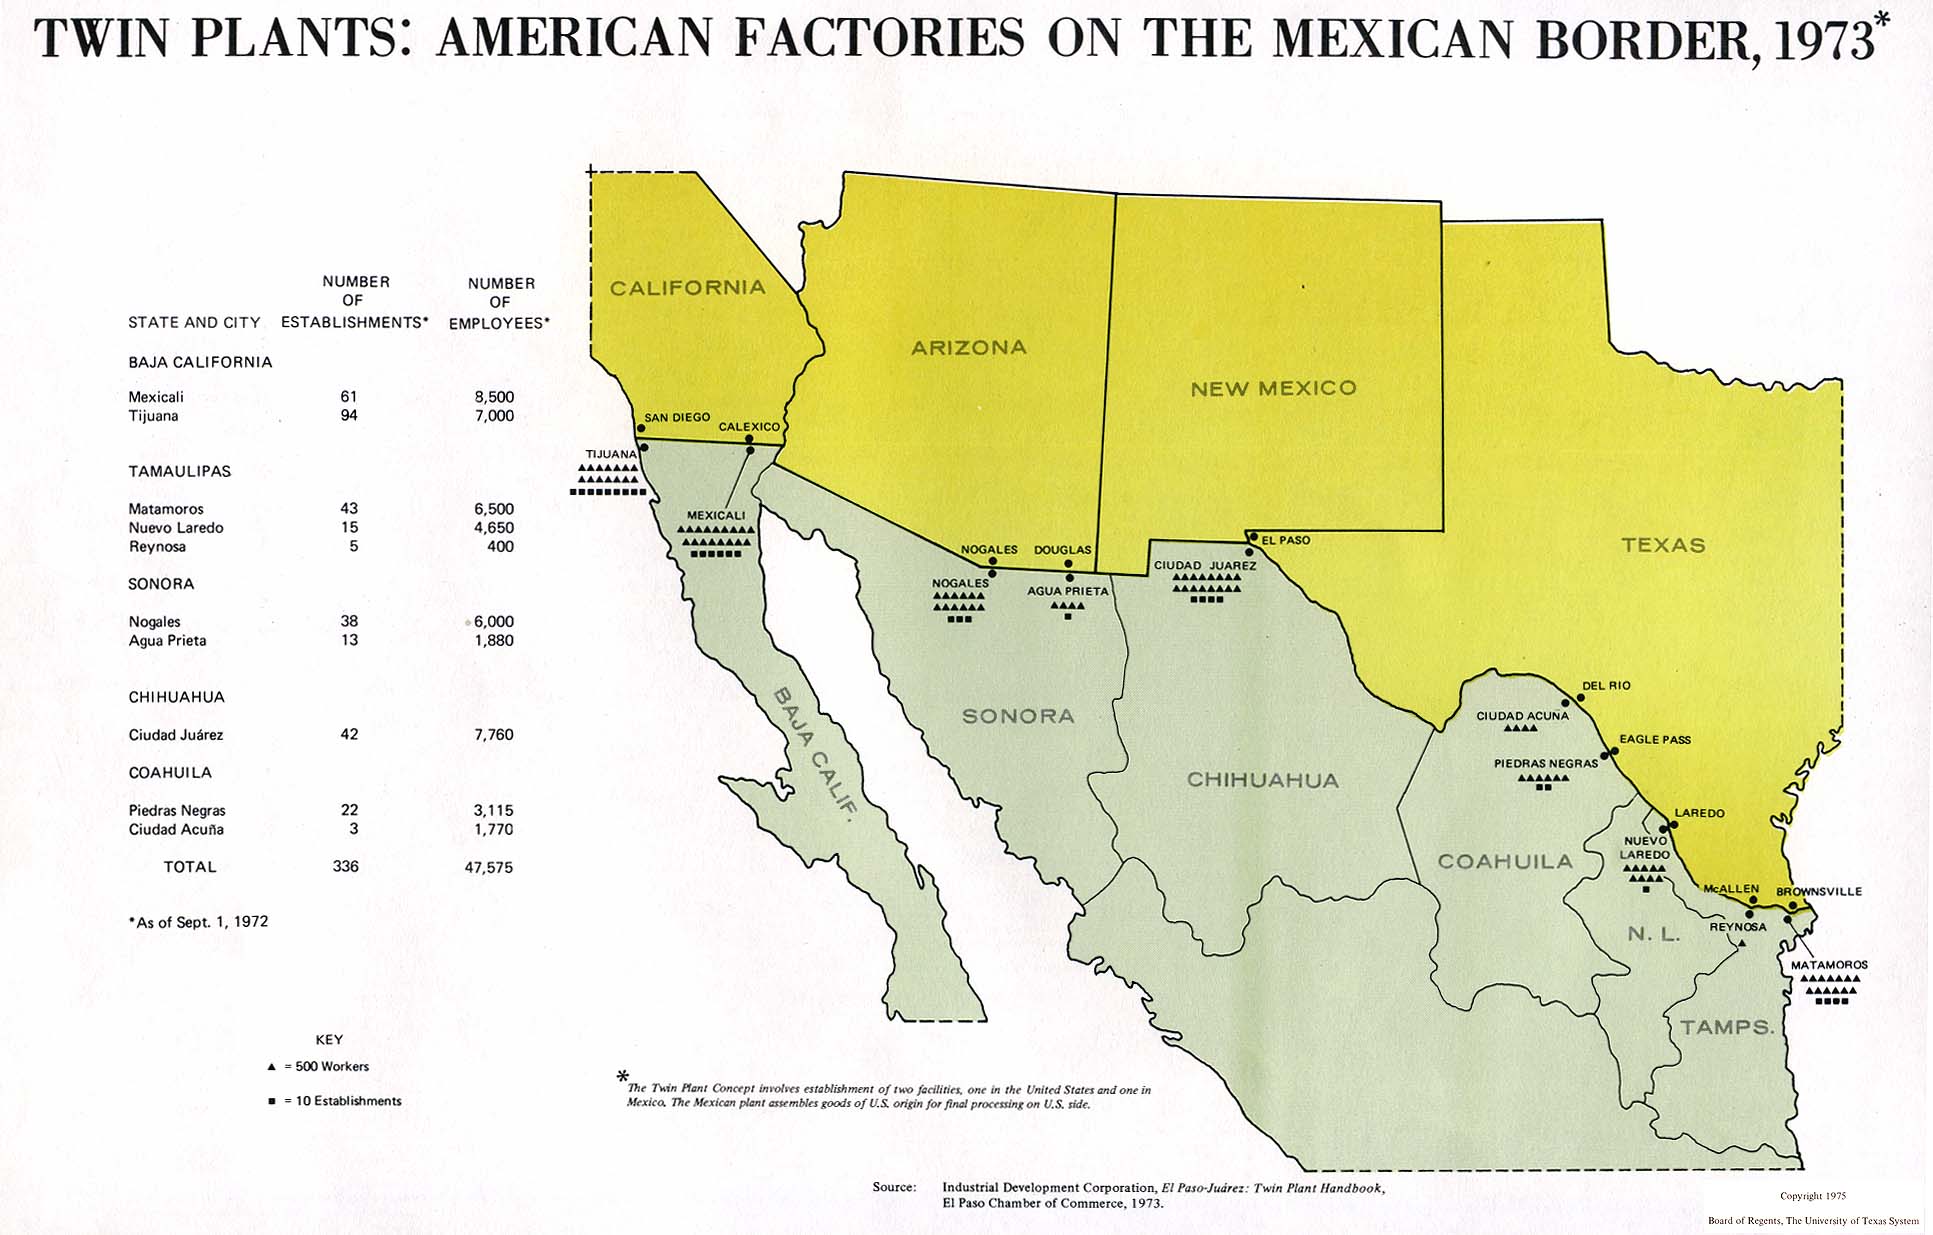
Twin Plants: American Factories on the Mexican Border (190K)
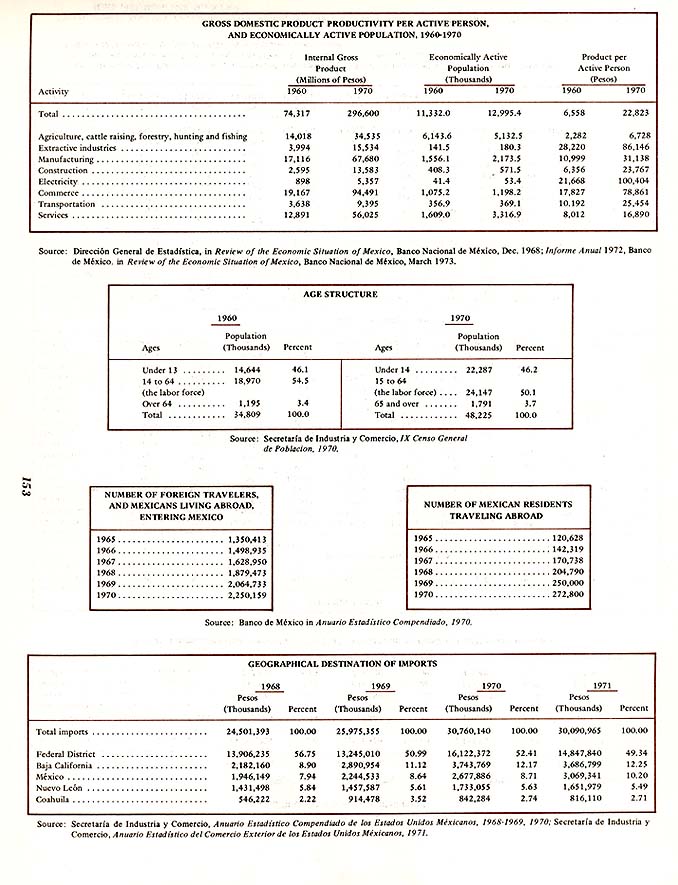
Gross Domestic Product, Productivity per Active Person, and Economically Active Population, Age Structure, Number of Foreign Travellers, and Mexicans Living Abroad, Entering Mexico, Number of Mexican Residents Travelling Abroad, Geographical Destination of Imports 1960-1970 (148K)
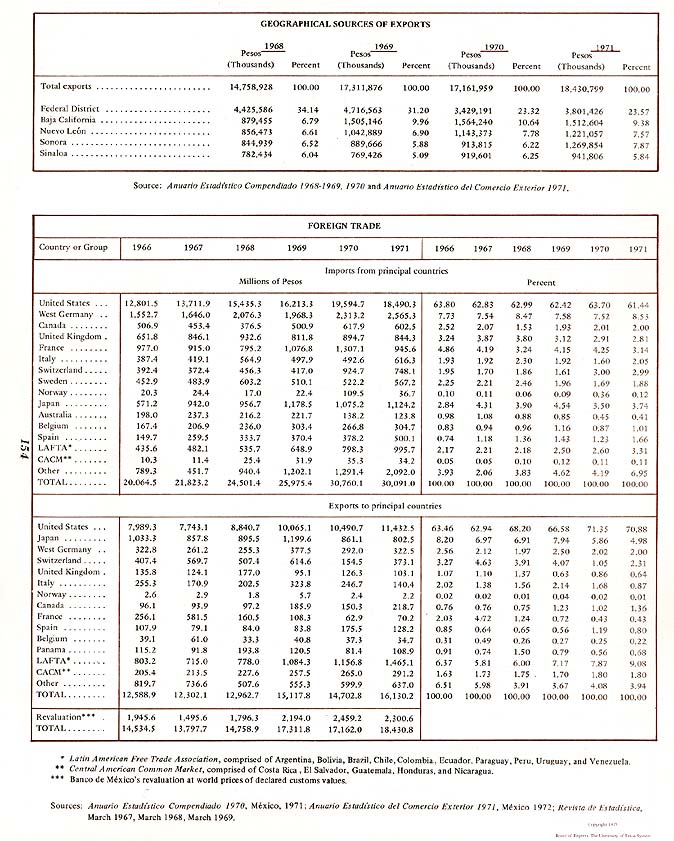
Geographical Sources of Exports, Foreign Trade (174K)
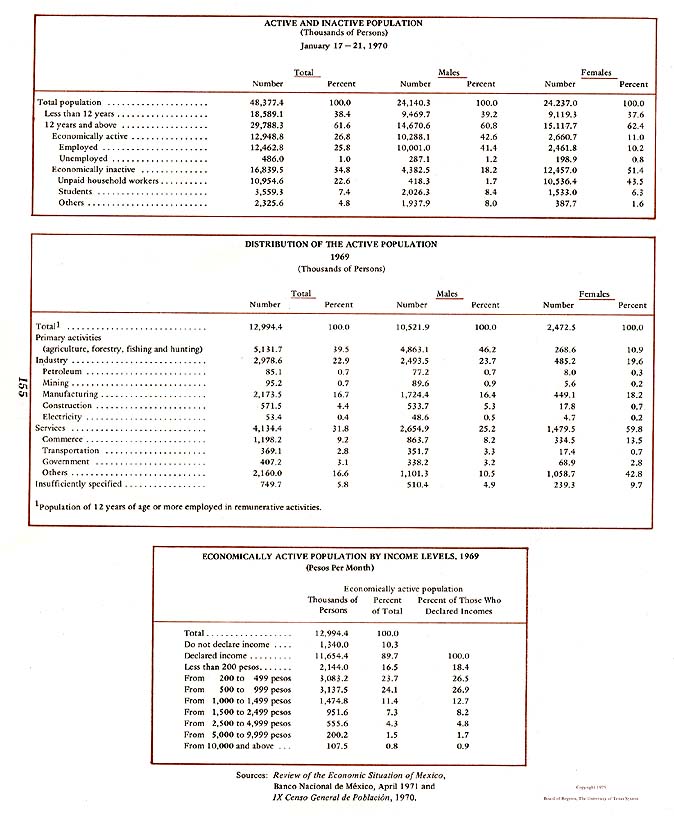
Active and Inactive Population, Distribution of the Active Population, Economically Active Population by Income Levels, 1969 (121K)
Balance of Payments (134K)
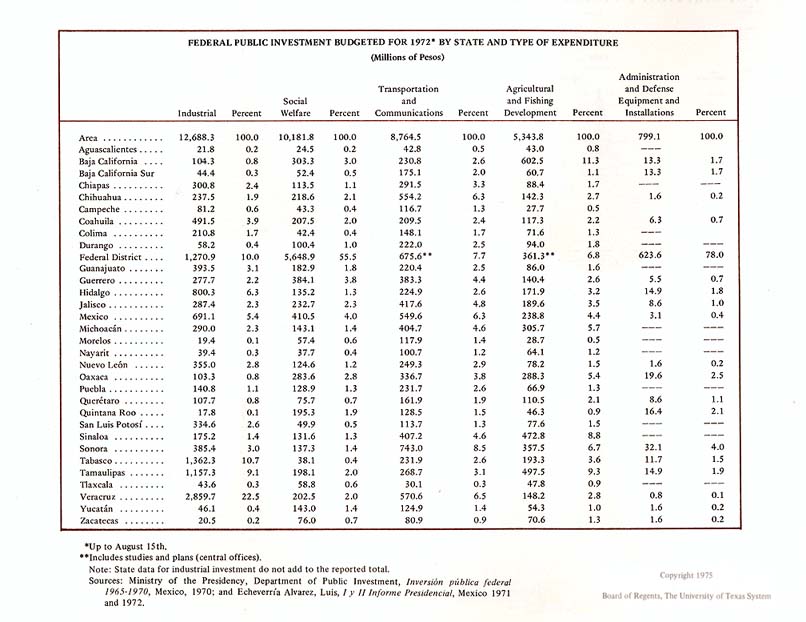
Federal Public Investment Budgeted for 1972 by State and Type of Expenditure (110K)
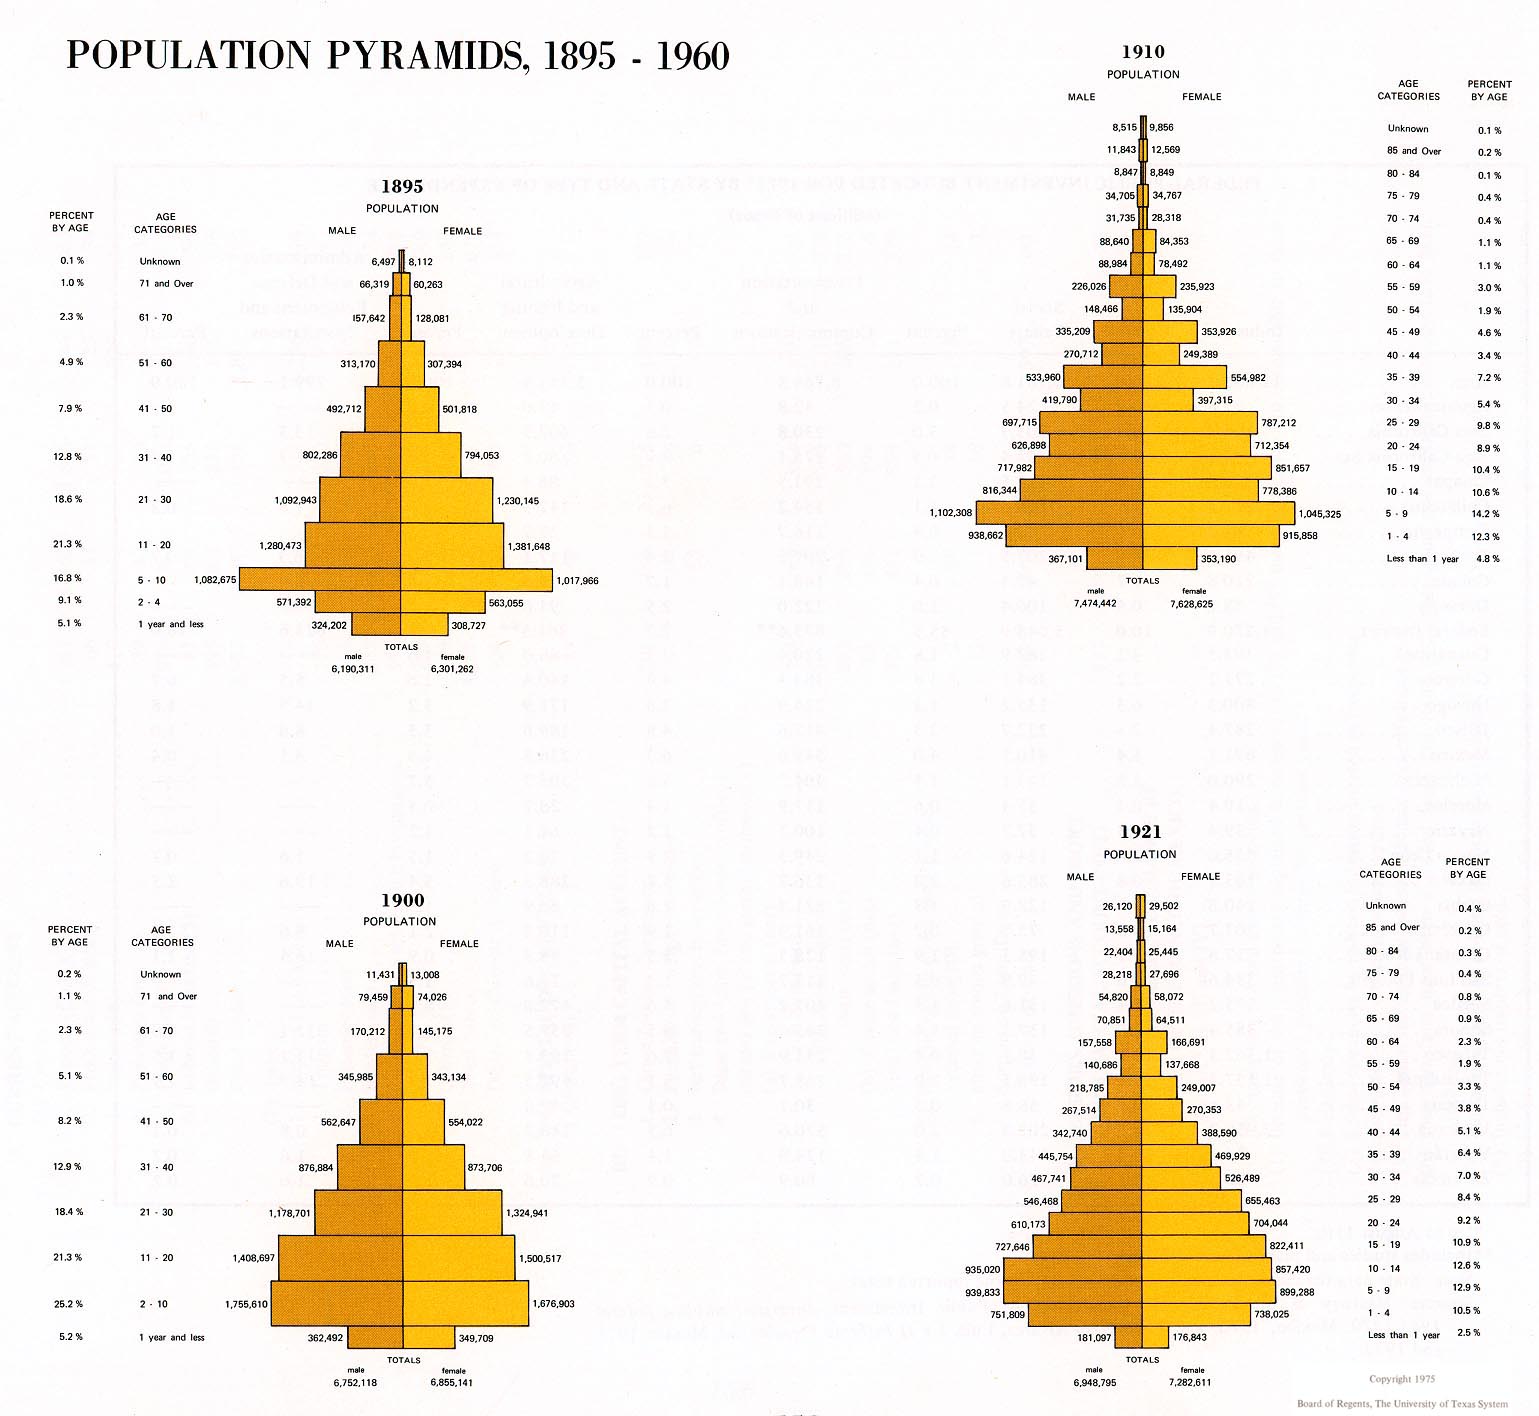
Population Pyramid, 1895-1960 (227K)
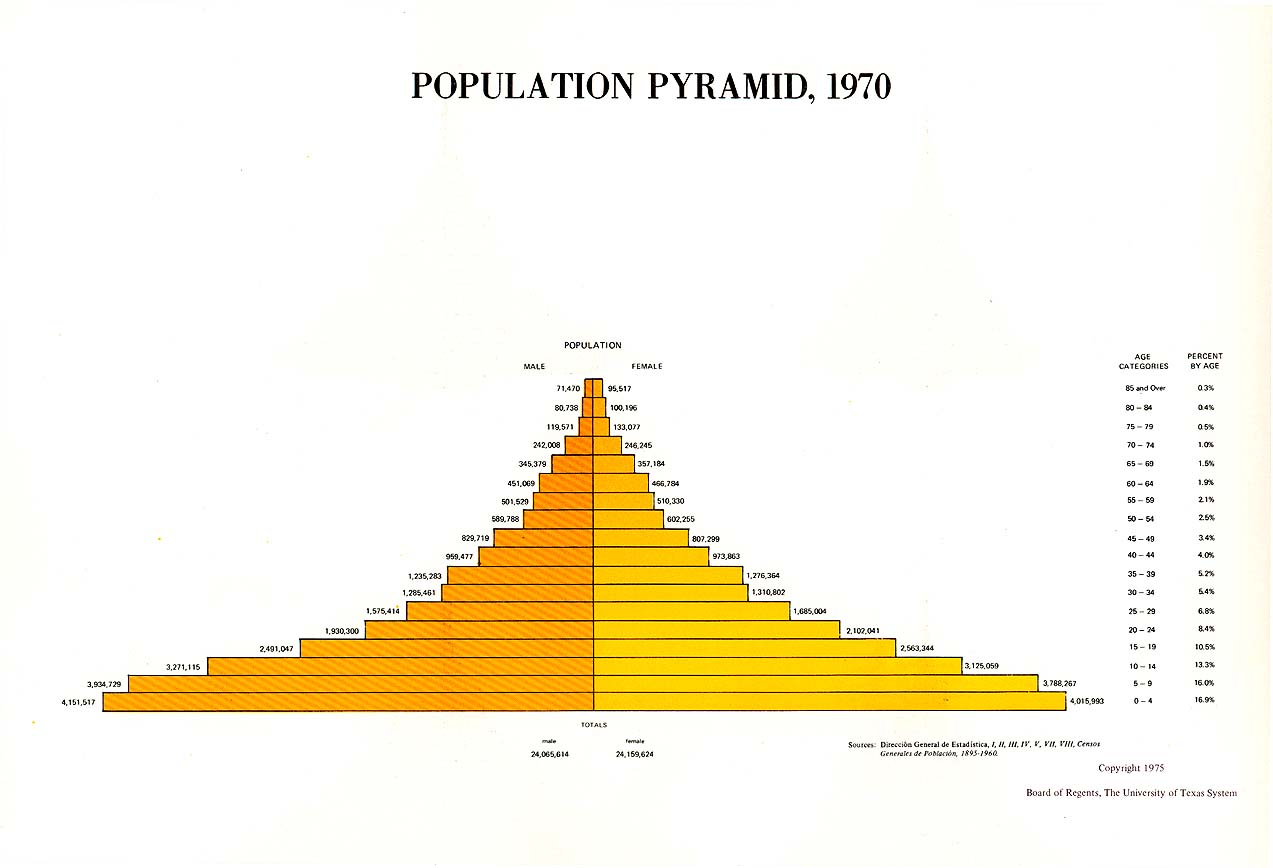
Population Pyramid, 1970 (89K)
Page One (410K)
Page Two (417K)
Maps FAQ
Map Room Guide
World
Africa
Americas
Asia
Australia/Pacific
Europe
Middle East
Polar/Oceans
Russia/Republics
U.S.
Texas
Historical
Thematic
Topographic
Other Map Sites
Map Sites
Map Dealers
Cartographic Reference
City Map Sites
Country Map Sites
Historical Map Sites
Outline Map Sites
Route Planning Sites
State Map Sites
Weather Map Sites
Topical Map Sites
Avian Influenza
Oil and Gas Maps
More Topical Maps
Perry-Castañeda Library
Map Collection
Atlas of Mexico
Note: All maps linked from this page are from Atlas of Mexico, published by the University of Texas at Austin Bureau of Business Research. All of these maps are Copyright 1975 Board of Regents, The University of Texas System. For information on using these maps, see the UTLOL Materials Usage Statement page.
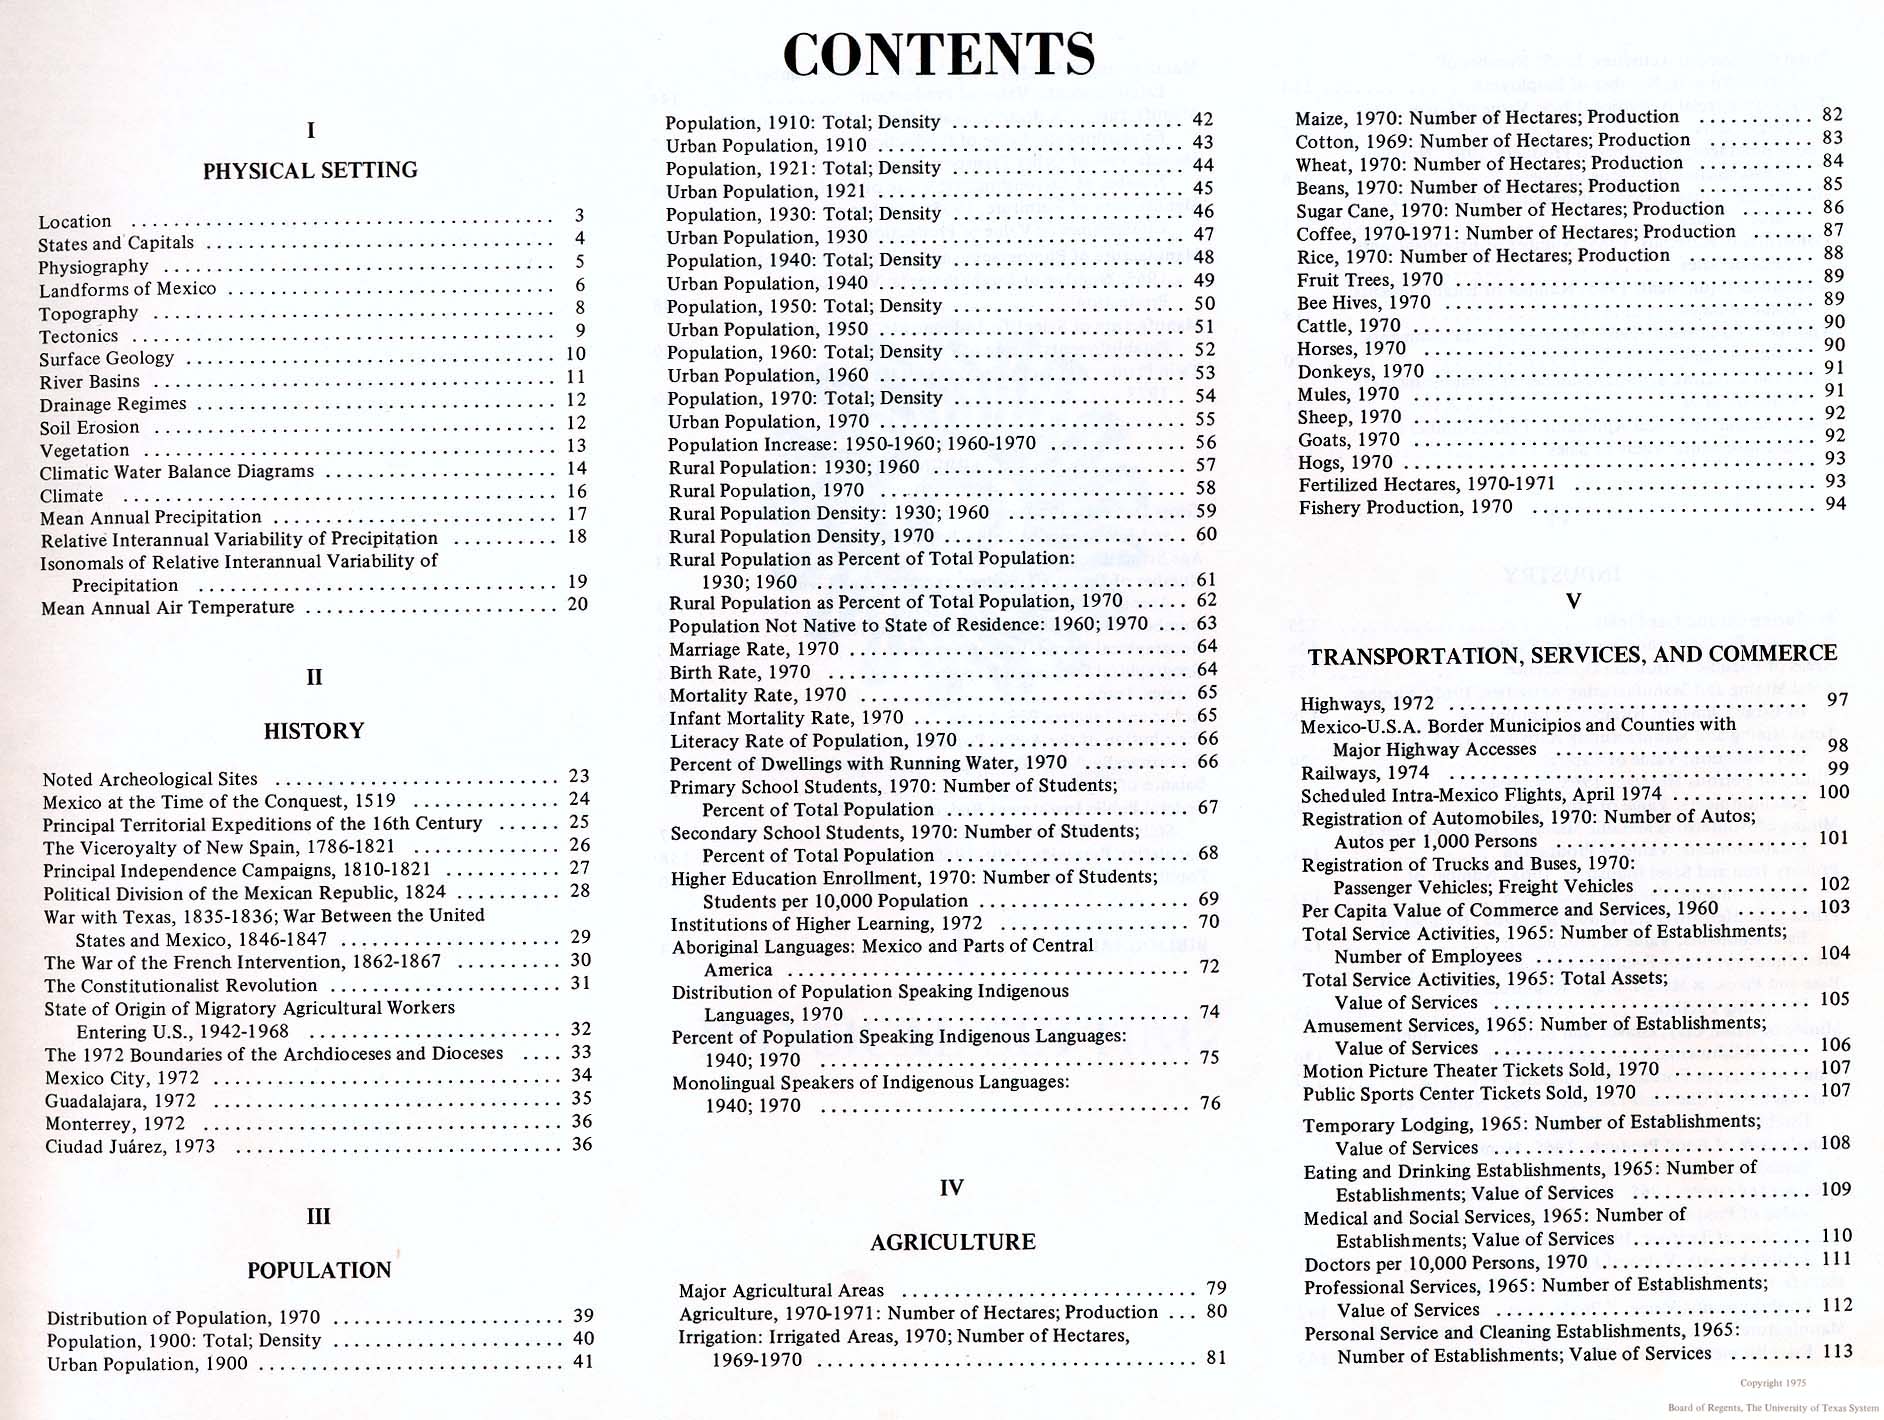
- Title Page (64K)
Physical Setting
History
Population
Agriculture
Transportation, Services, and Commerce
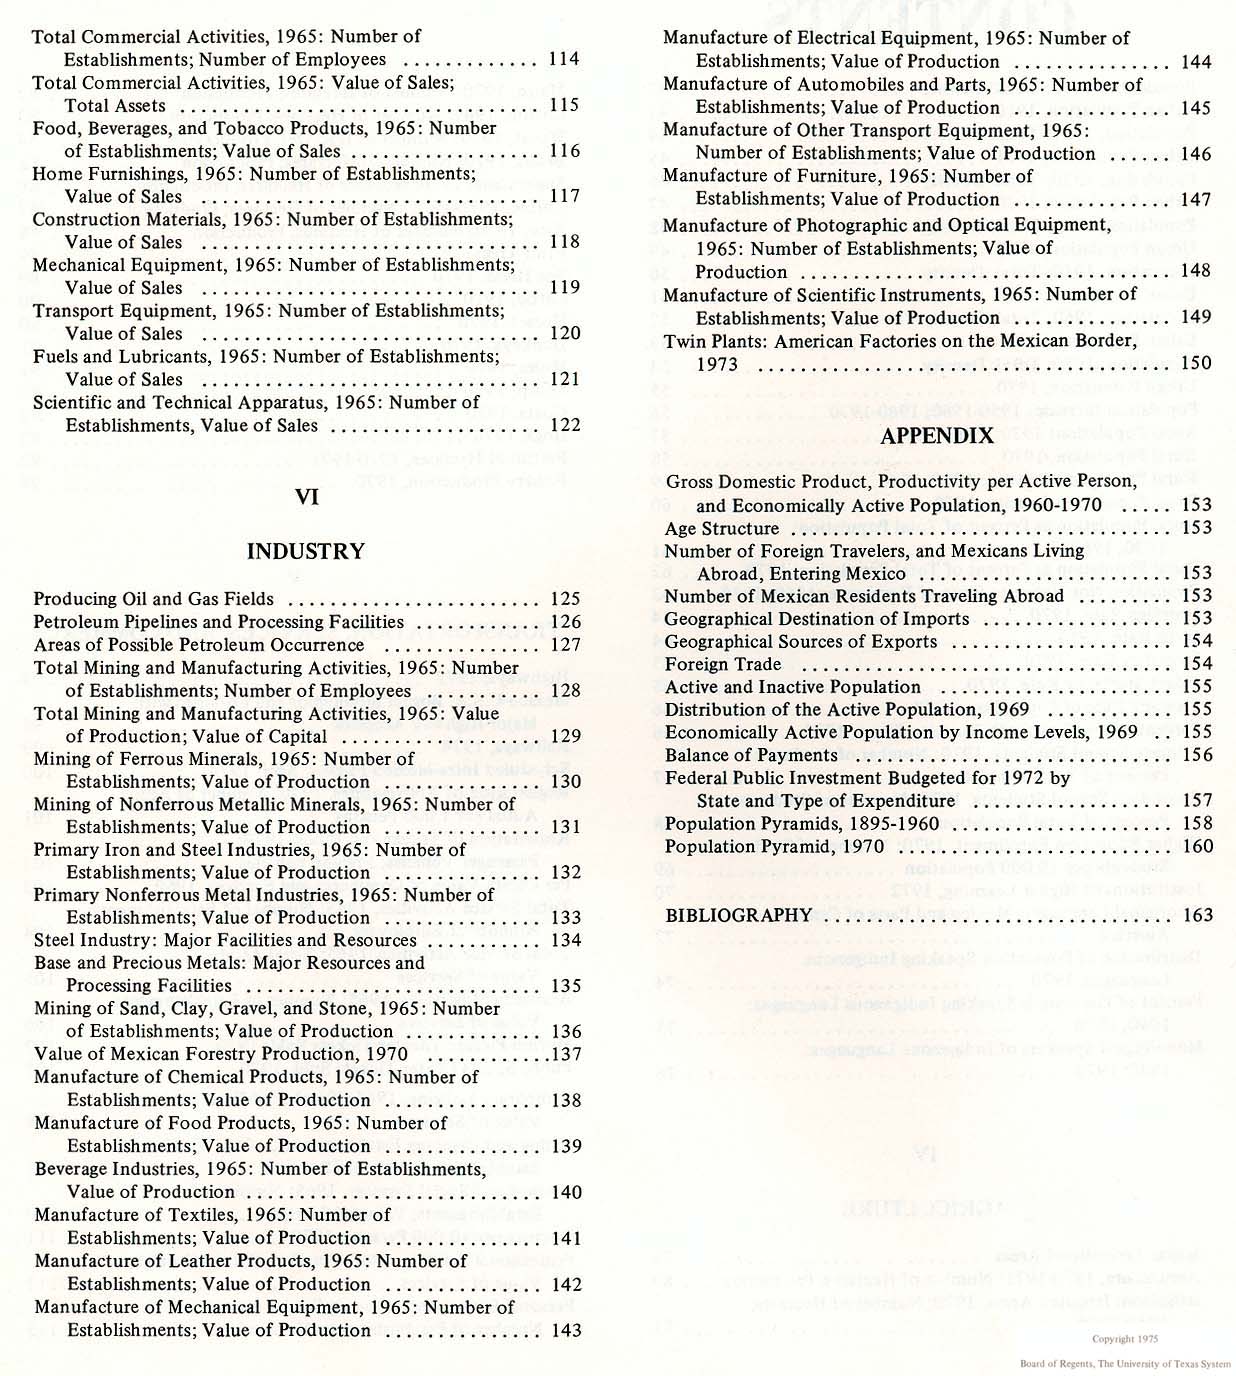
Industry
Appendix
Bibliography